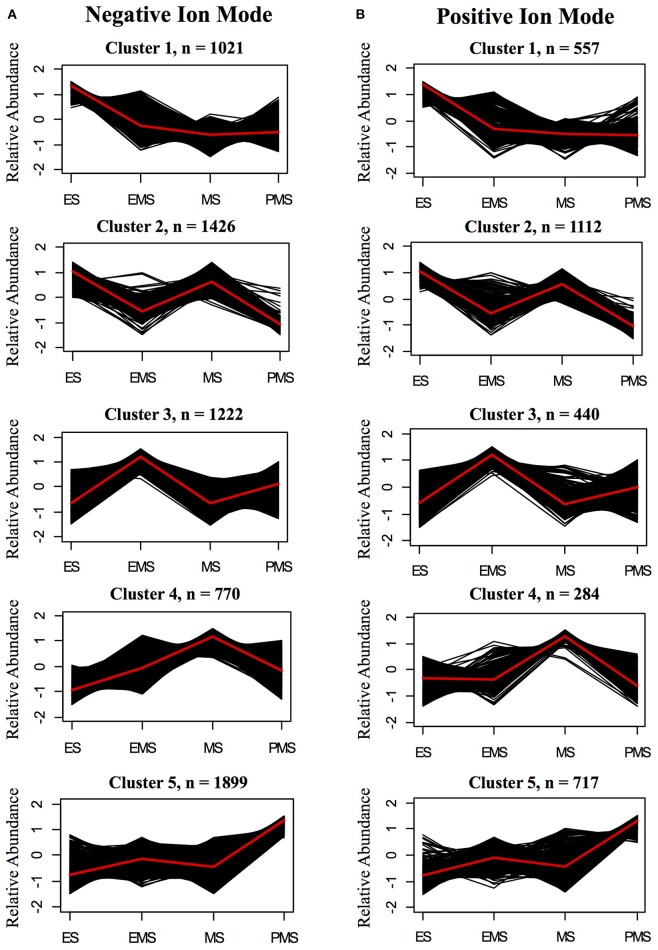
Figure 9.
K-means clusters of metabolites that change significantly during stem internode maturation in (A) negative ion mode (B) positive ion mode. The sampled stages are as follows: elongating stem (ES), early mature stem (EMS), mature stem (MS), and post mature stem (PMS). Metabolite ions that vary with a q-value < 0.01 by ANOVA were used for clustering analysis. The number of clusters was determined by silhouette plot. Metabolites that change in a similar pattern were grouped into five clusters. Relative abundance indicates the z-score which has the following equation: z-score = (x − μ)/σ, in which x is the average abundance of each metabolite in a given stage and μ and σ are the mean and standard deviation, respectively, for the metabolite across all four stages. Black lines show the z-score of each metabolite ion in the cluster and the red line shows the average for the cluster. The total number of metabolite ions in each cluster is indicated by n.

