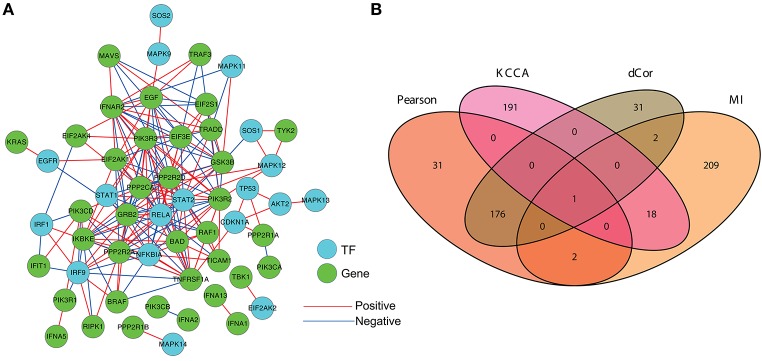
Figure 4.
The reconstructed gene coexpression regulatory network during HCV infection. (A) The gene association network constructed by the PCC-based method. Isolated genes are not shown. (B) The overlapping status of the inferred gene regulations by four association measures, i.e., Pearson, MI, KCCA, and dCor.

