Figure 2.

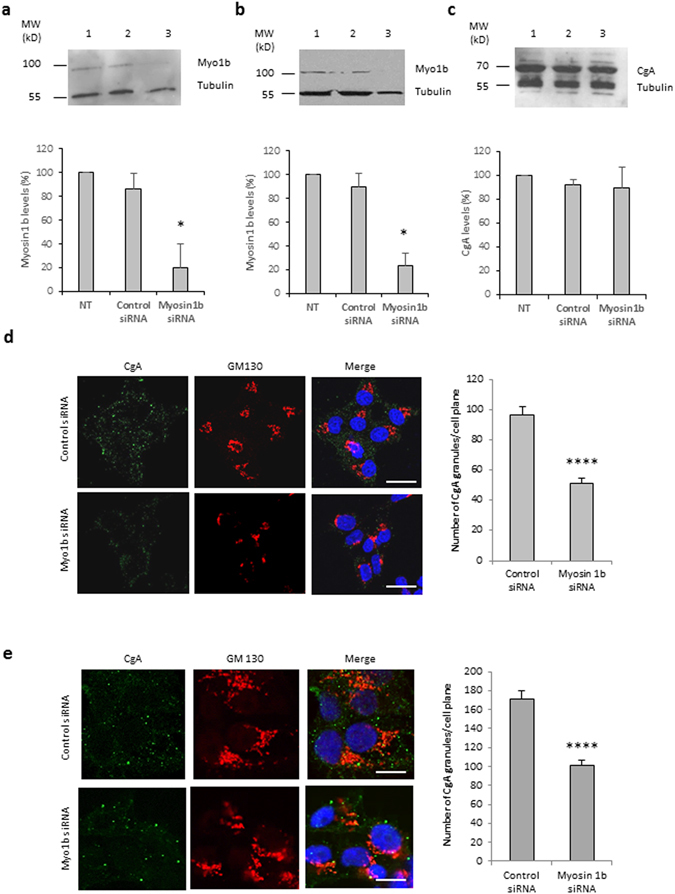
Myosin 1b depletion reduces the biogenesis of CgA-containing granules in PC12 and COS7 cells. (a–c) Protein extracts were analyzed by immunoblotting. Cropped blots showing protein expression levels of Myo1b and tubulin in lysates of COS7-CgA cells (a) or PC12 cells (b), non-transfected (lane 1), transfected with control siRNA (lane 2) or myosin 1b siRNA (lane 3). (c) Cropped blots showing protein expression levels of CgA and tubulin in lysates of PC12 cells, non-transfected (lane 1), transfected with control siRNA (lane 2) or myosin 1b siRNA (lane 3). Histograms represent a semi-quantitative analysis of the amount of myosin 1b or CgA found in cells transfected with control siRNA or myosin 1b siRNA from three independent experiments. *P < 0.05 (Mann-Whitney test). (Full-length blots of each tested protein are reported in Supplementary Figure S2). (d) PC12 cells were transfected with control siRNA or Myo1b siRNA, fixed, immunolabelled with anti-CgA and GM130 antibodies, and analyzed by confocal microscopy. Representative confocal microscopy sections throughout the cells are shown. The scale bar represents 10 µm. The number of CgA granules in PC12 cells transfected with control siRNA or Myo1b siRNA was quantified and expressed as mean + s.e.m. from three independent experiments (n = 36 cells). ****P < 0.0001 (Student’s t -test with Welch’s correction). (e) COS7-CgA cells were transfected with control siRNA or Myo1b siRNA, fixed, immunolabelled with anti-CgA and GM130 antibodies, and the distribution of CgA was analyzed by confocal microscopy. Representative confocal microscopy sections throughout the cells are shown. The scale bar represents 10 µm. The number of CgA granules in COS7-CgA cells, transfected with control siRNA or myosin 1b siRNA, was quantified and expressed as mean + s.e.m. from three independent experiments (n = 43 cells). ****P < 0.0001 (Mann-Whitney test).
