Figure 3.

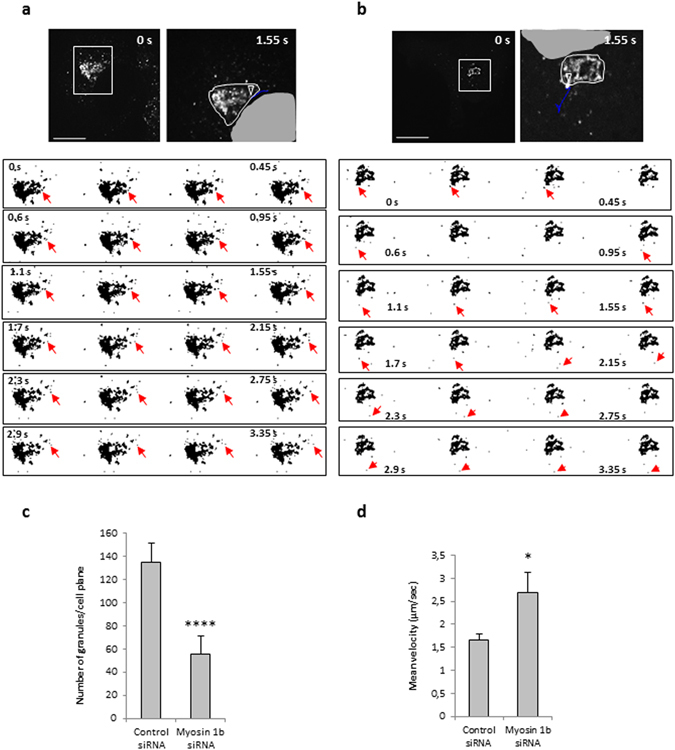
Myo1b depletion alters the number and the velocity of CgA granules. COS7 cells were first transfected with control siRNA (a) or myosin1b siRNA (b), and 24 h later with a plasmid encoding CgA-GFP. CgA-GFP carriers were monitored 5 h later at 37 °C by time-lapse imaging using spinning-disc confocal microscopy (see Movies 1 and 2). The first frames of representative movies (that cover 3.5 s) revealing the sequence of events of granule formation are shown. White boxes indicate the enlarged TGN region shown in image sequences. The right image in each panel corresponds to the enlarged region showing granule trajectory (in blue) along the image sequence, using the ‘manual tracking’ plugin of Image J. The arrow head indicates the position of the granule at the beginning of the tracking. The white line delimitates the Golgi region and the grey zone corresponds to part of the nucleus. The scale bars represent 10 µm. The red arrows indicate the position of the tracked granule every 150 ms. (c) The number of CgA-GFP granules was quantified, and expressed as mean + s.e.m. from three independent experiments (n = 20–24 cells). ****P < 0.0001 (Mann-Whitney test). (d) The mean velocities were calculated as the cumulated displacement of the granule from the location of its first observation to the end of the observation period with respect to the time of observation, and expressed as mean + s.e.m. from three independent experiments (N = 14–19 cells, n = 22–69 granules). *P < 0.05 (Mann-Whitney test).
