
Figure 4.
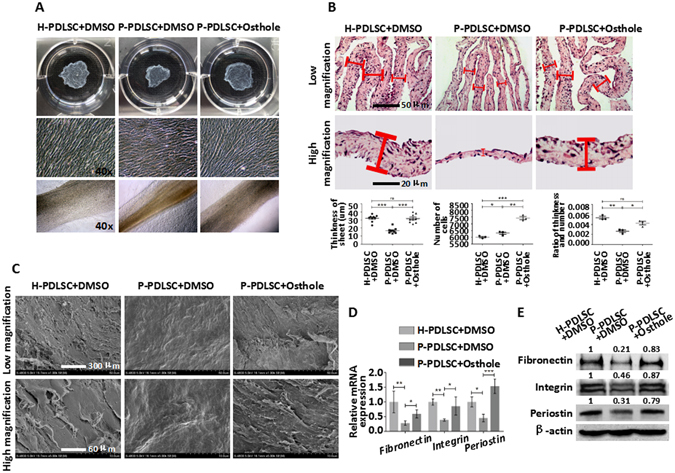
Osthole improves the formation of P-PDLSC sheet. (A) Representative macroscopic and microscopic images of H-PDLSC sheet, P-PDLSC sheet and P-PDLSC sheet with 10−7 Mol/L Osthole. (B) Representative H & E staining of H-PDLSC sheet, P-PDLSC sheet and P-PDLSC sheet with 10−7 Mol/L Osthole, and mean thickness of statistical analysis was shown below. Scale Bar, 50 μm (upper) and 20 μm (lower). (C) Representative SEM images of H-PDLSC sheet, P-PDLSC sheet and P-PDLSC sheet with 10−7 Mol/L Osthole. Scale Bar, 300 μm (upper) and 60 μm (lower). (D) Gene expression of Fibronectin, Integrin and Periostin in H-PDLSC sheet, P-PDLSC sheet and P-PDLSC sheet with 10−7 Mol/L Osthole as assayed by qRT-PCR. (E) Protein expression of Fibronectin, Integrin and Periostin in H-PDLSC sheet, P-PDLSC sheet and P-PDLSC sheet with 10−7 Mol/L Osthole as assayed by western blot. *P < 0.05, **P < 0.01, ***P < 0.001, ns: P ≧ 0.05, n = 3.