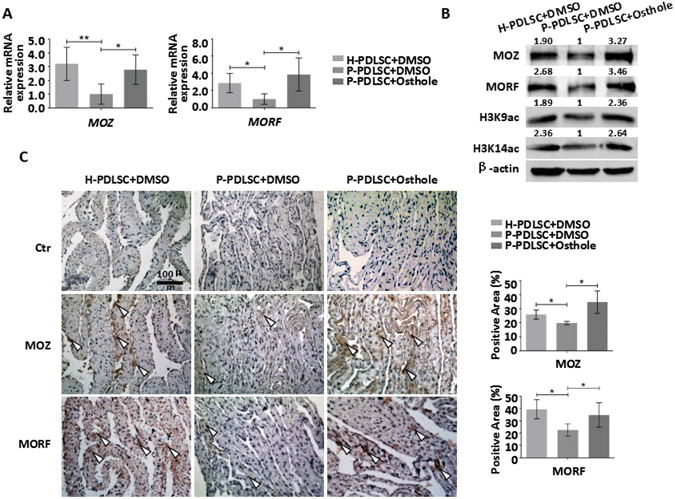
Figure 6.

Expression of MOZ and MORF in PDLSC sheets with Osthole treatment. (A) Gene expression of MOZ and MORF in H-PDLSC sheet, P-PDLSC sheet and P-PDLSC sheet with 10−7 Mol/L Osthole. (B) Protein expression of MOZ, MORF, H3K9ac and H3K14ac in H-PDLSC sheet, P-PDLSC sheet and P-PDLSC sheet with 10−7 Mol/L Osthole. (C) Representative images of immunohistochemistry staining of MOZ and MORF in H-PDLSC sheet, P-PDLSC sheet and P-PDLSC sheet with 10−7 Mol/L Osthole. Semi-quantification of the positive area of MOZ and MORF was calculated. Scale Bar, 100 μm. *P < 0.05, **P < 0.01, n = 3.
