Figure 1.

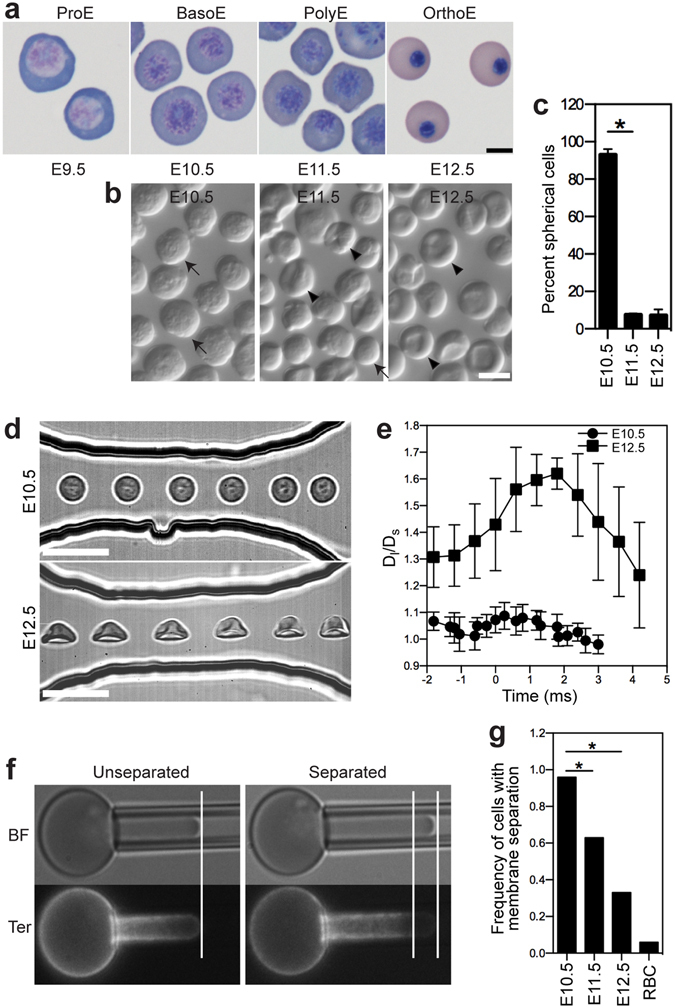
Primary primitive erythroblasts alter their cell shape, gain the capability to deform, and develop increasing mechanical stability as they transition from BasoE at E10.5 to OrthoE at E12.5. (a) Circulating primitive erythroblasts transition from ProE at E9.5 to OrthoE at E12.5 as a single cohort in the bloodstream. ProE, proerythroblasts; BasoE, basophilic erythroblasts; PolyE, polychromatophilic erythroblasts; PolyE/OrthoE, polychromatophilic and orthochromatic erythroblasts; and OrthoE, orthochromatic erythroblasts. (b) Primitive erythroblasts alter their cell shape from spherical to partially concave as they progress from BasoE at E10.5 to OrthoE at E12.5. Freshly isolated fetal blood cells were visualized by light microscopy. Cells were identified as being spherical (arrows) versus partially concave (arrow heads). Scale bar represents 10 µm. (c) The proportion of spherical primitive erythroblasts at different time points is quantified. Numbers represent at least 300 total cells per sample and error bars are SEM of three different independent experiments per stage. *p = 3.09e-6. (d) Images of primitive erythroblasts at the BasoE stage (E10.5) and the OrthoE stage (E12.5) in the microfluidic channel. Scale bar represents 20 µm. (e) Aspect ratio (Dl/Ds) changes of deforming primitive erythroid cells in the microfluidic channel. Dl, cell length; Ds, cell width. Time 0 indicates the time when cells enter the constriction channel. (f) Membrane mechanical stability of primitive erythroblasts was examined using fluorescence imaged microdeformation (FIMD). Brightfield (BF) and fluorescence images (Ter) of AlexaFluor 488-Ter119-labeled erythroid cell deformation. Left panel: In FIMD images of mechanically stable cells, the edges of cell boundary in brightfield (lipid bilayer) coincide with the distribution of Ter119 fluorescence (presence of the membrane cytoskeleton). Right Panel: Mechanical failure of the membrane cytoskeleton was indicated by the formation of skeletal-free regions that lack Ter119 fluorescence at the tip of the micropipette aspirated cell projection in FIMD images. (g) Frequency of maturing primitive erythroblasts and adult RBCs exhibiting membrane cytoskeletal failure in FIMD analysis. *p = 0.0017, **p = 9.53e-7. RBCs, adult red blood cells.
