
Fig. 1.
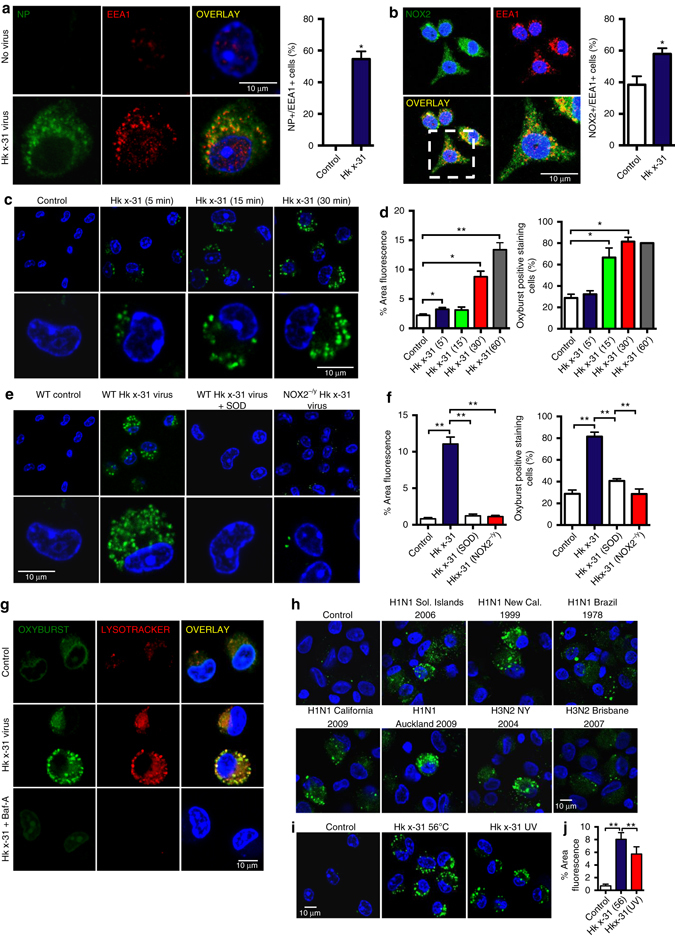
Seasonal and pandemic influenza A viruses induce endosomal ROS production via activation of NOX2 oxidase. a, b Confocal microscopy of wild-type (WT) mouse primary alveolar macrophages that were infected with influenza A virus strain HKx31 (MOI of 10) for 1 h and labeled with antibody to the early endosome antigen 1 (EEA1) and antibodies to either a influenza A virus nucleoprotein (NP) or b NOX2, and then with 4′,6′-diamidino-2-phenylindole (DAPI; blue). Also shown is the quantification of results (n = 5). c, d Time-dependent elevation in endosomal ROS levels in mouse primary alveolar macrophages as assessed by OxyBURST (100 μM) confocal fluorescence microscropy and labeled with DAPI (n = 5). e, f Endosomal ROS production in WT, NOX2−/y and superoxide dismutase (SOD; 300 U/ml)-treated WT mouse primary alveolar macrophages as assessed by OxyBURST confocal fluorescence microscopy in the absence or presence of HKx31 virus and labeled with DAPI (n = 5). g Uninfected and HKx31 virus-infected mouse primary alveolar macrophages were labeled with OxyBURST and the acidified endosome marker Lysotracker (50 nM). Some cells were treated with bafilomycin A (Baf-A; 100 nM) to suppress acidification of endosomes (n = 4). h Human alveolar macrophages infected with seasonal H3N2 (A/New York/55/2004, A/Brisbane/9/2007), seasonal H1N1 (A/New Caledonia/20/1999, A/Solomon Islands/3/2006) and pandemic A(H1N1) pdm09 strains (A/California/7/2009, A/Auckland/1/2009) and labeled with OxyBURST for endosomal ROS (n = 4). i, j Endosomal ROS production in WT mouse primary alveolar macrophages as assessed by OxyBURST fluorescence microscopy exposed to either heat (56 ºC)-inactivated HKx-31 virus (to block virus fusion) or UV-inactivated HKx-31 virus (to block replication) and labeled with DAPI (n = 4). a–i Images are representative of >150 cells analyzed over each experiment. Original magnification ×100. a, b, d, f and j Data are represented as mean ± S.E.M. a and b Students’ unpaired t-test *P < 0.05. d, f and j One-way ANOVA followed by Dunnett’s post hoc test for multiple comparisons. *P < 0.05 and **P < 0.01. Scale bars: 10 µm