
Fig. 5.
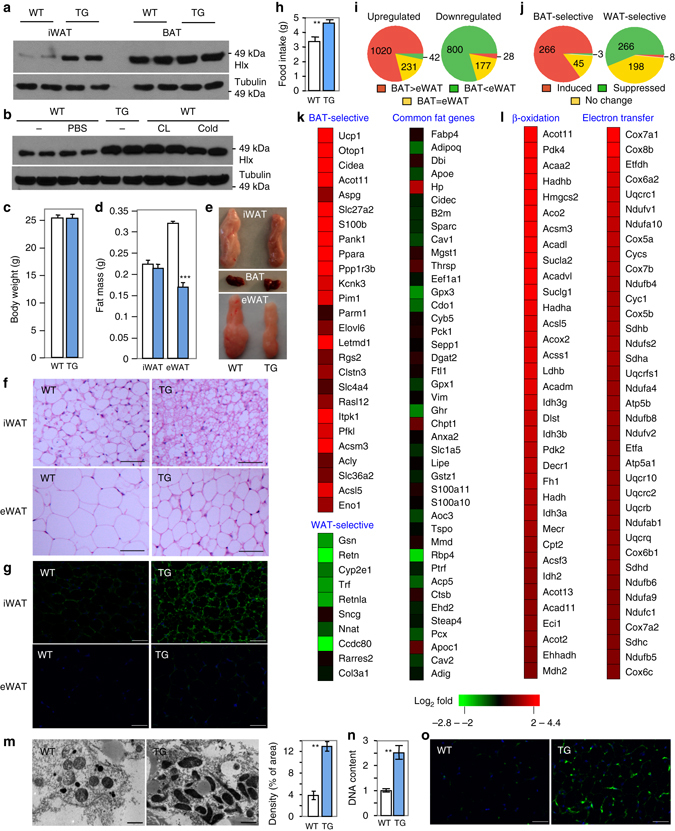
Hlx transgene systematically remodels iWAT to generate a brown-like fat. a Western blot analysis of Hlx protein in fat depots of transgenic mice and control mice. b Mice were intraperitoneally injected with a single dose of CL-316,243, or placed at 4 °C for 6 hr. Hlx protein levels in iWAT were compared with that of Hlx transgenic mice. c Body weights of 10-week-old male (n = 4–5 per group). d Fat mass of mice shown in (c). White bar, wild type; Blue bar, transgenic mice. e Representative images of BAT, iWAT and eWAT. f H&E staining of iWAT and eWAT of 12-week-old mice. Scale bar, 200 µm. g Ucp1 immunofluorescence staining of iWAT and eWAT of 12-week-old mice. Shown are representative images of three mice per genotype. Green, Ucp1; Blue, DAPI. Scale bar, 200 µm. h Daily food intake of 12-week-old male mice (n = 5 per group). i 1293 significantly upregulated genes (left) and 1005 significantly downregulated (right) genes were identified in the iWAT of Hlx transgenic mice. In wild type mice, these genes have either similar expression between BAT and eWAT, higher expression in BAT, or higher expression in eWAT. Shown are distributions of these genes. j Distribution of BAT-selective (left) and WAT-selective genes (right) based on how they are regulated in the iWAT by the Hlx transgene. k Heat maps of relative expression levels of top BAT-selective genes, WAT-selective genes and common fat genes in iWAT of Hlx transgenic mice vs. control mice. l Heat maps of relative expression levels of mitochondrial β-oxidation enzymes and electron transfer chain components that were significantly upregulated by at least 2-fold in the iWAT of transgenic mice. m Mitochondrial density (n = 3 mice per genotype). Bar, 1 µm. n Relative mitochondrial DNA content by qPCR (n = 4 mice per genotype). o CD31 immunofluorescence staining of iWAT of 12-week-old male mice. Shown are representative images of three mice per genotype. Green, CD31; Blue, DAPI. Scale bar, 200 µm. All error bars represent s.e.m. Two-tailed unpaired Student’s t-test was performed. *p < 0.05; **p < 0.01; ***p < 0.001