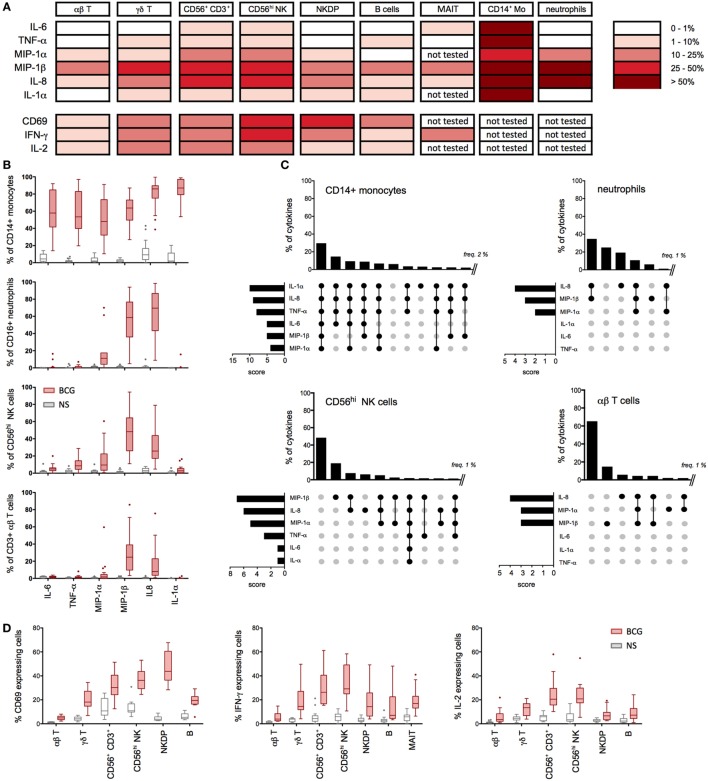
Figure 3.
Multiple cell types contribute to the bacillus Calmette–Guérin (BCG) protein signature. (A–D) Whole-blood samples from 15 to 20 healthy donors were stimulated with BCG for 16 h in the presence of Brefeldin A (added 1 h after BCG) and assessed for cytokines production using specific cytometry panels (Table S2 in Supplementary Material). (A) Summary table representing the median values for the percentage of cytokine- and chemokine-positive cells (background signal from NS cells subtracted, n = 15–20) after 16 h of stimulation with BCG. (B) Tukey box-whisker plots indicate the percentages of cytokine-positive cells for CD14+ monocytes (n = 20), CD16hi neutrophils (n = 18), CD56hi NK cells (n = 20), and αβ T cells (n = 20). NS: non-stimulated condition. (C) Boolean gating analyses of the expressed cytokines measured in (A) are shown for monocytes, neutrophils, CD56hi NK cells, and αβ T cells. Vertical bar graphs represent the percentage of each cytokines combination above 2% for monocytes and above 1% for other populations. Data are ranked from the greatest to the least expressed gated population of cytokine-producing cells. Horizontal bar graphs indicate the rank order of cytokine expression; the score represents the number of times each cytokine is present in a Boolean combination. The cytokines expressed in each combinatorial gate are represented with a black dot, connected by a solid black line. The cytokines not expressed are indicated by unconnected gray dots. (D) Tukey box-whisker plots indicate the expression of IFN-γ, IL-2, and CD69 for the indicated cell populations.

