Figure 5.
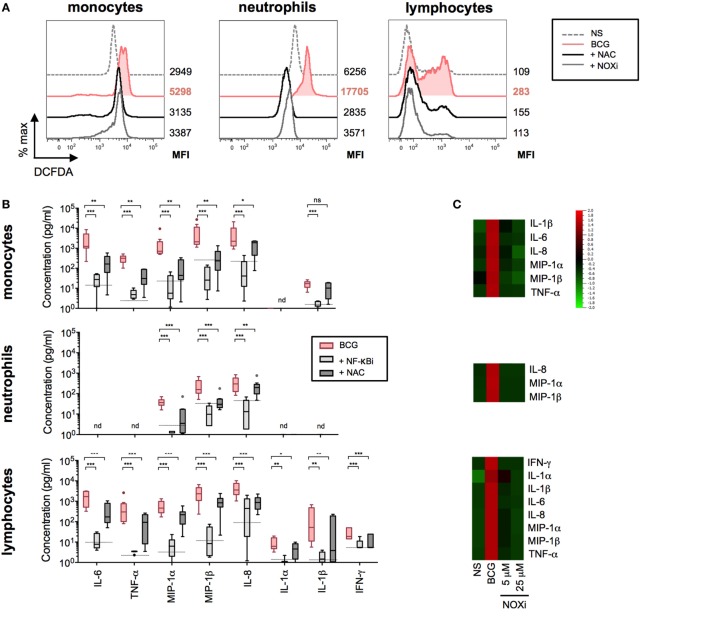
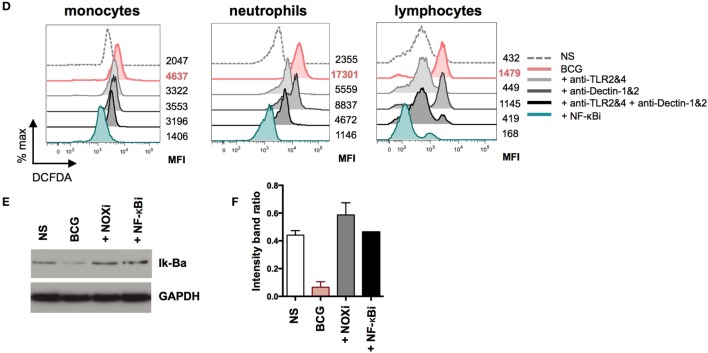
Bacillus Calmette–Guérin (BCG)-induced NF-κB and reactive oxygen species (ROS) activation results in the coordinated production of cytokines. (A) Representative histograms showing intracellular ROS production, measured by flow cytometry using dichlorofluorescin diacetate (DCFDA) assay on purified monocytes, neutrophils, and lymphocytes (n = 2) incubated with media control (dotted line); BCG in the presence of DMSO vehicle control, 5 mM N-acetyl-l-cysteine (NAC), or 5 µM of NOXi for a total of 5 h. (B) Concentrations of cytokines were determined by Luminex assay for purified monocytes (n = 9), neutrophils (n = 9), and lymphocytes (n = 9) stimulated with BCG in the presence of DMSO vehicle control, or NF-κB inhibitor, or NAC. The dotted lines indicate the median value for unstimulated samples. nd, not detected. p Values were determined by the paired Student’s t test and false discovery rate corrected for multiple analyte testing. *q ≤ 0.05; **q ≤ 0.01; ***q ≤ 0.001 as compared to BCG + DMSO control. (C) Heat map representation using median concentration measured of the listed cytokines for purified monocytes (n = 4), neutrophils (n = 4) and lymphocytes (n = 4) stimulated with media control [non-stimulated (NS)], BCG in the presence of vehicle control DMSO, or with 5 or 25 µM of NOXi, for 5 or 16 h for lymphocytes. (D) Representative histograms of intracellular ROS measured on purified monocytes (n = 6), neutrophils (n = 8), and lymphocytes (n = 6) stimulated for a total of 5 h with media control, BCG plus isotype control antibodies, BCG in the presence of neutralizing anti-TLR2&4, anti-Dectin-1&2, anti-TLR2&4 + anti-Dectin-1&2, or NF-κB inhibitor. The MFI values for each condition are shown to the right of the histograms. (E) Immunoblot analysis of Iκ-Bα and GAPDH from total leukocytes stimulated for 45 min with media alone (NS), BCG and DMSO vehicle control, BCG in the presence of NOX inhibitor, or NF-κB inhibitor (n = 3). (F) Band intensity was calculated using the ImageJ software, and the ratio of Iκ-Bα/GAPDH is represented by histograms.


