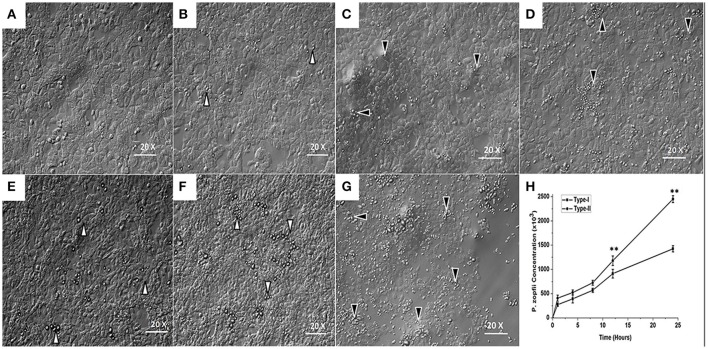
Figure 5.
Adhesion of P. zopfii and its effect on bMECs morphology at different time of infection. (A) control, (B,C) 4 h, (D,E) 12 h, and (F,G) 24 h. Black arrowheads show the type-II, while white arrowheads show type-I cells adhesion. (B,C,E,F) There were no significant changes in bMECs, (D) Depicting slight cells morphological changes in type-II at 12 h, (G) Showing disruption of monolayer of bMECs in type-II at 24 h. (H) Time course of the survival and adhesive capability of P. zopfii in bMECs that increased significantly with passage of time. Data indicated as Mean ± SD of three independent experiments. **p < 0.01.

