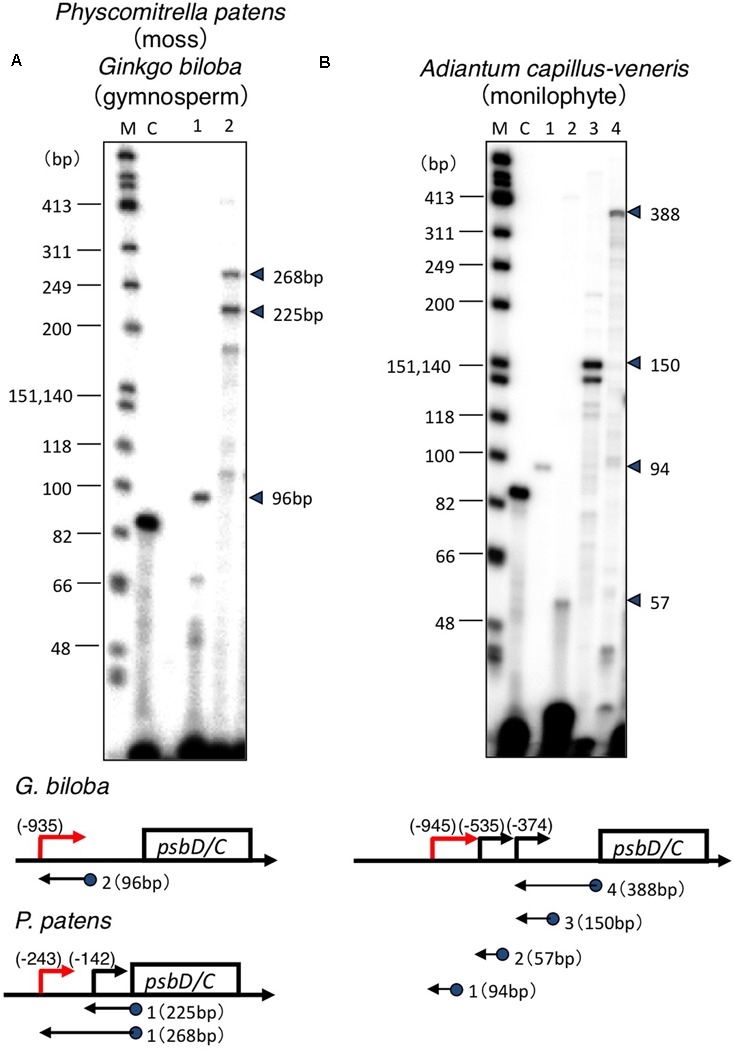
FIGURE 2.

Mapping of the 5′ ends of the psbD transcripts. Analysis of the psbD transcripts of the moss P. patens and primitive gymnosperm G. biloba (A), and monilophyte A. capillus-veneris (B) by primer extension assays. Primers used are indicated by numbers on the top of each lane. The size of the extension product is shown on the right. The position of primers and the size of the extension products are shown on the gene map. The deduced sites of the 5′-end of each transcript are shown as numbers in parentheses. Lane C shows an experiment with the control RNA and primer provided by the manufacturer that produces an 87-base primer extension product.
