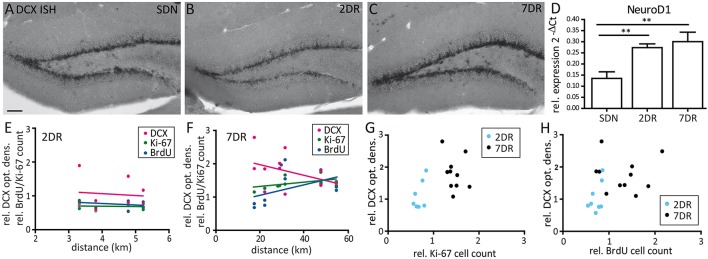
Figure 3.
Expression of Ki-67, BrdU, and DCX do not correlate with the running distance. (A–C) Representative in situ hybridization for DCX mRNA in an SDN (A), 2DR (B), and 7DR mouse (C). DCX mRNA expression is increased after 7 days of running. (D) RT-qPCR analysis for NeuroD1 shows a continuous increase for 2DR and 7DR which was significant compared to the SDN group (p < 0.01 for 2DR vs. SDN and 7DR vs. SDN, respectively; ANOVA with Newman-Keuls post-test). RT-qPCR analysis given as 2−ΔCt values relative to the house-keeping gene s12 (N = 6 mice per group, values given as mean ± SEM). (E) Correlation analysis between running distance and cell counts for BrdU or Ki-67 or optical density of DCX expression in the 2DR group relative to the SDN group. Linear regression analysis revealed no significant correlation for any marker (magenta: DCX, green: Ki-67, blue: BrdU). (F) Same as in (E) but for the 7DR group. No significant correlation was found between marker expression and running distance. (G) Correlation analysis between the relative Ki-67 cell count and optical density of DCX for the 2DR (blue) and 7DR groups (black). There was no significant correlation between both measures within each group. (H) Same representation as in (G) but for BrdU and DCX. No correlation was found within each group.

