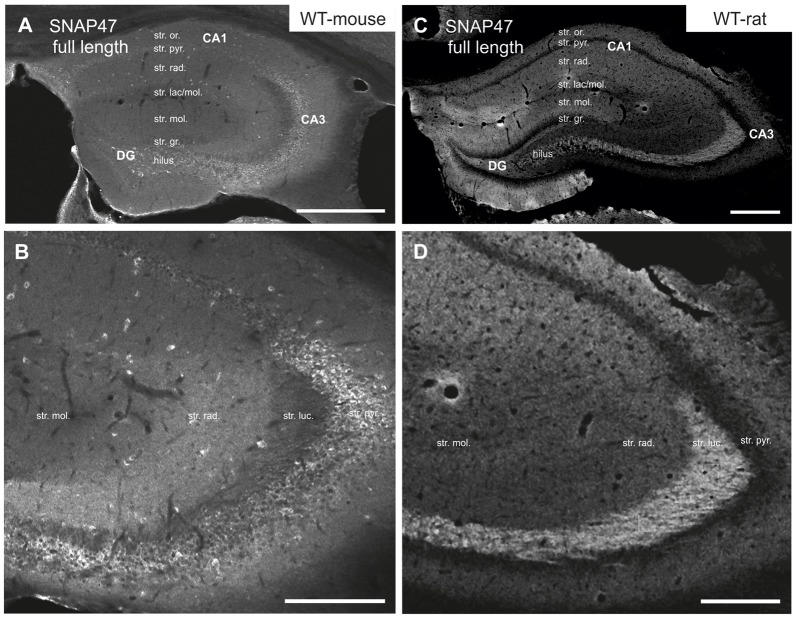
Figure 2.
Immunofluorescence labeling pattern of SNAP47 in the hippocampus of WT mice and rats. (A,B) Confocal images of SNAP47 immunolabeling in the mouse hippocampus. Note the highly labeled neurons scattered across all areas and layers of the hippocampus. The intensity of SNAP47 is stronger in the cell body layer and stratum radiatum of the CA3, contrary to the CA1 area. The lowest immunolabeling of SNAP47 is observed in the CA3 stratum lucidum. (C,D) Confocal images of SNAP47 immunolabeling in rat hippocampus. Note that in the rat section the scattered neurons are not labeled and the labeling intensity is low in the cell body layers. The high intensity of SNAP47 labeling is observed in the stratum lucidum of the CA3 and the stratum radiatum of CA1 area. Scale bars represent, (A–C), 500 μm; (B), 200 μm; (D), 275 μm.

