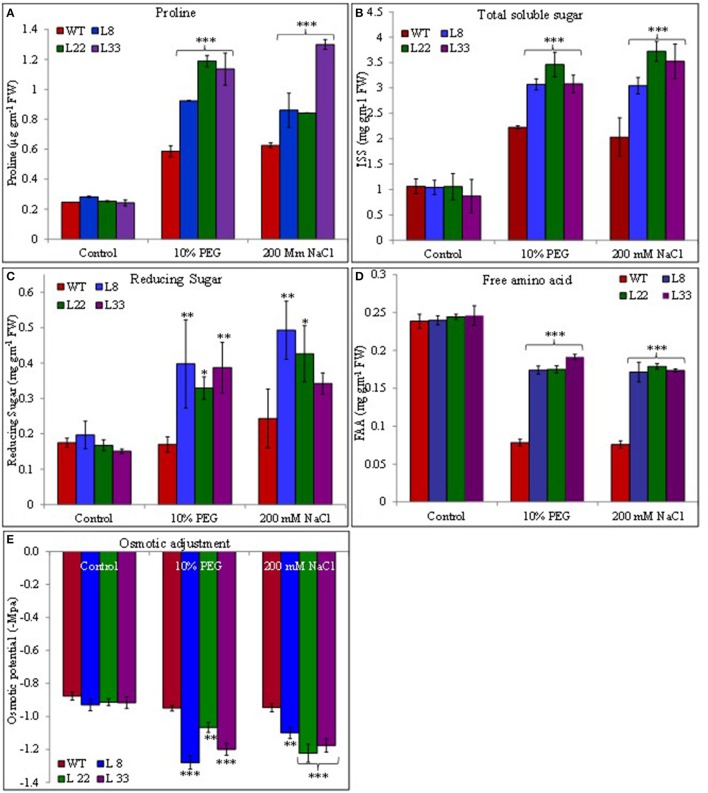
Figure 10.
Comparison of proline (A), total soluble sugar (B), reducing sugar (C), free amino acid (D) contents, and osmotic potential (E) in WT and transgenic tobacco under control and stress (drought and salt) conditions. The *, **, and *** denote statistical significance in responses of transgenic lines against control at P value ≤0.05, 0.01, and 0.001 respectively.

