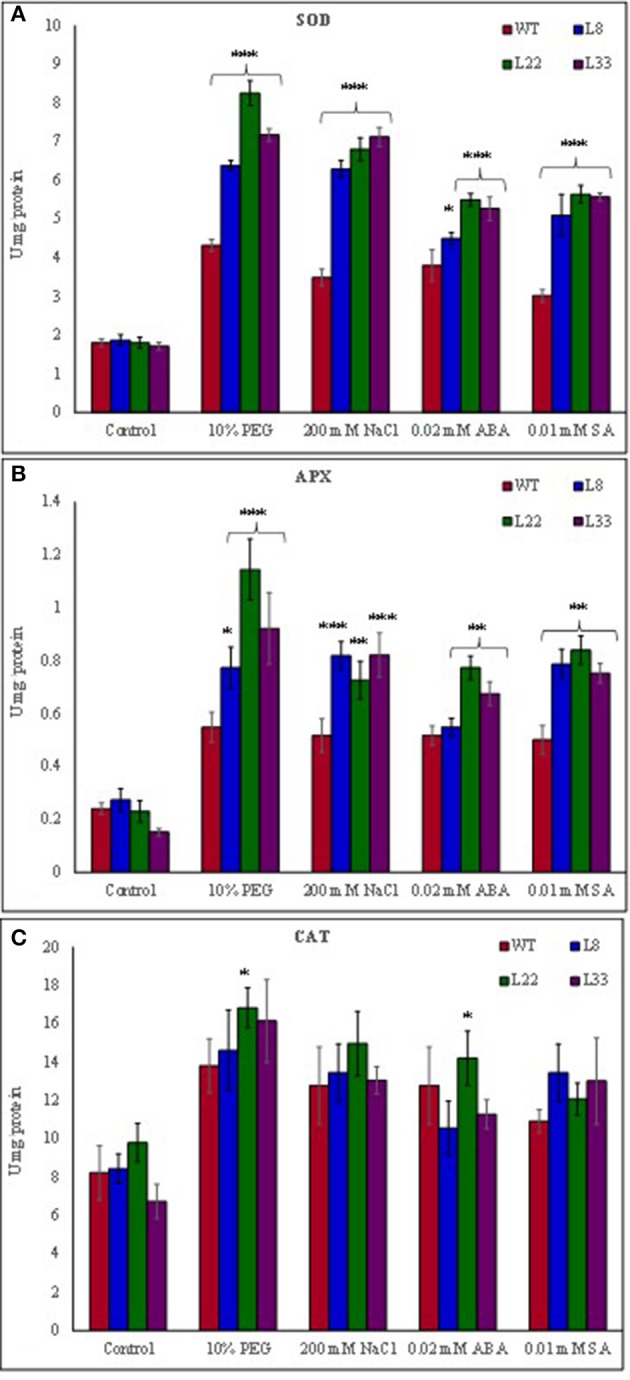
Figure 6.

Comparison of activity SOD (A), APX (B), and CAT (C) in WT and transgenic tobacco under control and stress (drought and salt) conditions. The *, **, and *** denote statistical significance in responses of transgenic lines against control at P value ≤0.05, 0.01, and 0.001 respectively.
