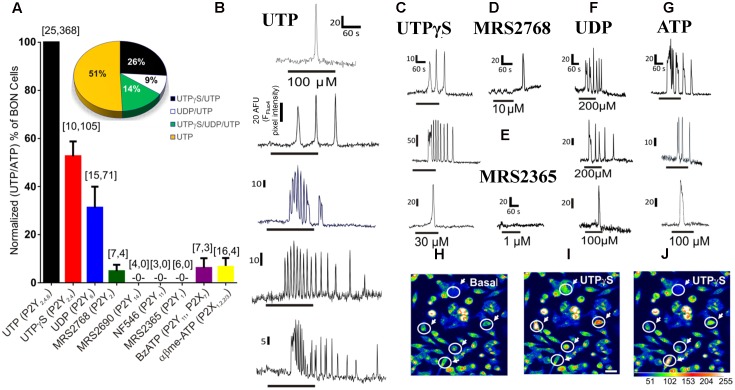
FIGURE 1.
Pharmacology of purinergic receptors linked to Ca2+responses in BON cells. (A) Percentage of UTP (or ATP) responsive cells displaying Ca2+ responses to selective purinergic agonists. Ca2+ responses were normalized to % of UTP or ATP responsive cells, since same subset of cells were always responsive to both agonists; the first number inside the brackets represents the number of cultures and the second is the number of responsive cells. The Ca2+ response to agonists follows the order of UTP/ATP > UTPγS > UDP >> MRS2768 = BzATP = α,β-MeATP > MRS2365, MRS2690, NF546. Pie graph inset shows the response patterns to agonists obtained from consecutive applications of UTPγS, UDP and UTP in the same cells of a single experiment, n = 69 cells; repeated in N = 5 cultures. Representative Ca2+ transients are shown for (B) UTP, (C) UTPγS, (D) MRS2768, (E) MRS2365, (F) UDP and (G) ATP. Line below the transient indicates duration of drug application. Each of the drugs was perfused at the concentrations indicated in Supplementary Table 1 for 1 min followed by ATP (or UTP) for UTPγS, UDP and MRS2768 or MRS2365) perfusion with a 10–15 min washout between each drug application. (H–J) Representative pseudocolor images of Ca2+ responses to 30 μM UTPγS, plotted on a pixel intensity scale from 0 to 255. Responsive cells are circled with an arrow. Scale bar = 30 μm.

