FIGURE 10.
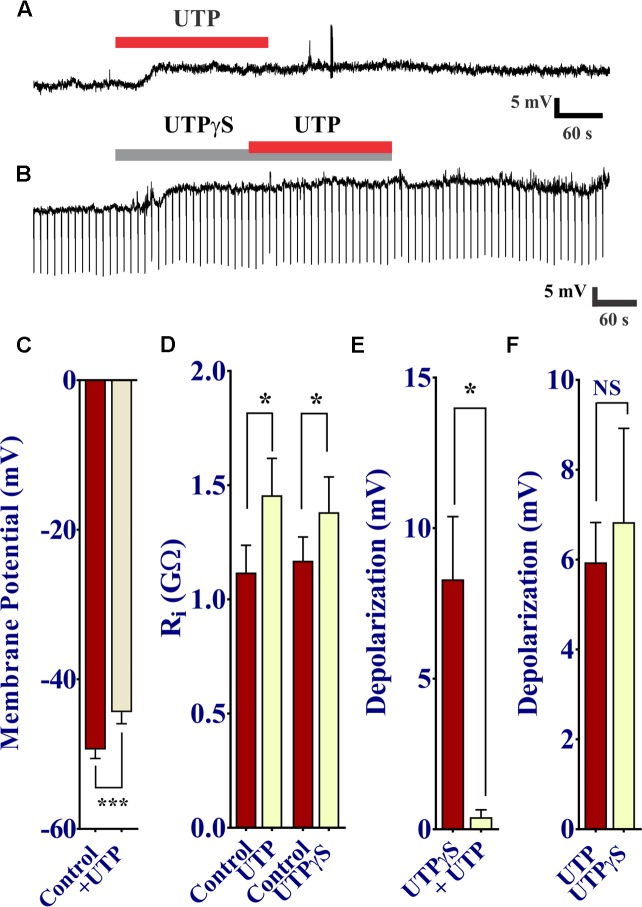
UTP depolarizes the membrane potential in human BON. (A) Acute application of 100 μM UTP causes Vm depolarization (upper trace, representative response), associated with an increase in cell input resistance (Ri; (B), lower panel; 1.12 ± 0.12 GΩ for control vs. 1.46 ± 0.16 GΩ for UTP, p = 0.01, n = 7; 1.12 ± 0.10 GΩ for control vs. 1.38 ± 0.15 GΩ for UTPγS, p = 0.038, n = 6). UTPγS mimicked UTP evoked Vm depolarization and if UTPγS is used to depolarize the cell, UTP no longer has any effect (lower trace). (C) UTP causes a significant depolarization of the membrane potential. (D) UTP or UTPγS causes a modest but significant increase in cell input resistance. Bars, SEM. Asterisk denotes statistical significance when analyzed with student’s t-test. (E) UTPγS induced Vm depolarization prevents the response to subsequent co-application of UTP (8.30 ± 2.08 mV for UTPγS and 0.40 ± 0.24 mV for UTP, p = 0.0165, n = 5). (F) UTP and UTPγS evoked a similar Vm depolarization (p > 0.05, NS; 5.94 ± 0.88 mV for UTP and 6.83 ± 2.09 mV for UTPγS, n = 17 and 6, respectively).

