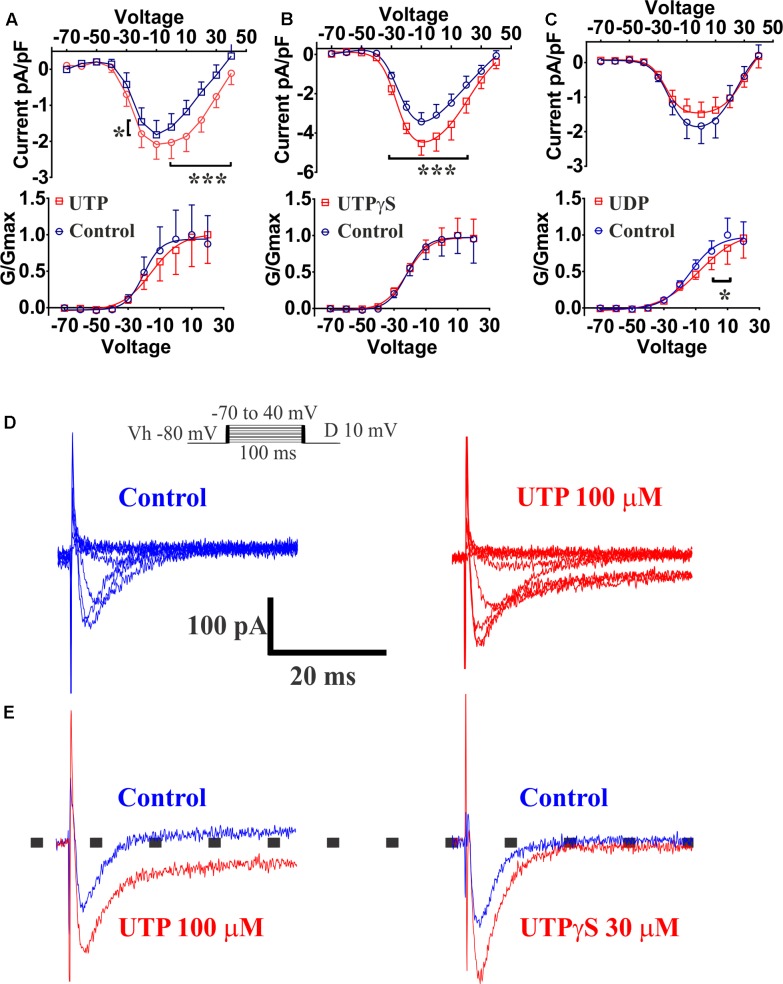
FIGURE 13.
UTP increased currents carried by VOCC in a BON cell model of EC. Acute application of 100 μM UTP increased the magnitude of the currents carried by VOCCs while shifting the voltage dependence to the right. Acute application of UTPγS increased VOCC conductance (Ica) without affecting its voltage dependency. (A–C) Effect of bath application of UTP, UTPγS and UDP, respectively, are summarized as current/voltage curves (top panels). There was an increase in the Ica currents after application of UTP (at Vm of –20, 0, to 40 mV, p < 0.0001, n = 10) and UTPγS (at Vm of –30 to 20, p < 0.0001, n = 6) but not in the presence of UDP (n = 8, p > 0.05). Bottom panels show voltage-response curves plotted as normalized conductance (G/Gmax) against voltage (mV), and adjusted by a Boltzmann dose-response equation. There was ∼5 mV shift in the voltage dependence when UTP was applied (–20.33 ± 5.611 mV control vs. –15.35 ± 8.045 mV UTP, n = 10, p = 0.1842) and a 5.7 mV shift when UDP was applied (–13.57 ± 4.22 mV control vs. –7.85 ± 7.99 mV UDP, n = 8, p = 0.0028). There was not any difference in voltage dependency with UTPγS (–21.94 ± 3.70 mV control vs. –21.81 ± 3.595 mV UTPγS, n = 6). (D) Representative current-trace for one cell before and after UTP stimulation (top panels up to 0 mV). (E) Representative control traces (blue) and after application (red) of UTP (left) and UTPγS (right). Persistence in the Ica currents during the voltage steps was observed after stimulating the cells with UTP but not after UTPγS. Cells were depolarized from a holding potential of –80 mV with10 mV increasing voltage steps, which ranged from –70 to 40 mV with a duration of 100 ms (insert panel in D). Current amplitude was normalized to individual cell capacitance and showed as pA per pF. Data are plotted as mean ± SEM. Data were analyzed by two-way ANOVA, and statistical significances are denoted with asterisks (∗∗∗p < 0.001; ∗p < 0.05).

