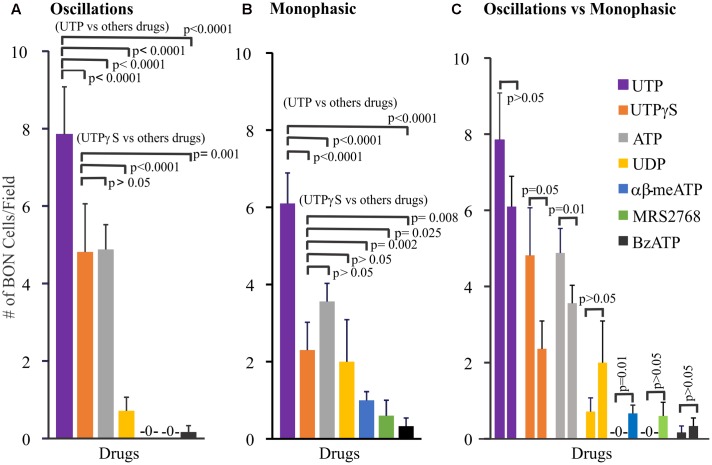
FIGURE 2.
Profile of different Ca2+-responses evoked by agonists for purinergic receptors in human BON. Agonists elicit monophasic Ca2+ transients or Ca2+ oscillations. (A) Profile of agonist responses for Ca2+ oscillations. (B) Profile of agonist responses for monophasic Ca2+ transients. (C) Comparison of the number of cells displaying oscillations (first column) versus monophasic (second column) Ca2+ transients in response to each purinergic agonist. Poisson regression was used for statistical comparisons in (A,B), and t-test in (C). For this analysis only one drug at a time was tested in each cell culture. Concentrations of each drug are listed in Supplementary Table 1 (see results for more details). The average number of cells/field was 46 ± 8. The proportion of cells responding to UTP is ∼20%; for UTPγS, it was 11%.

