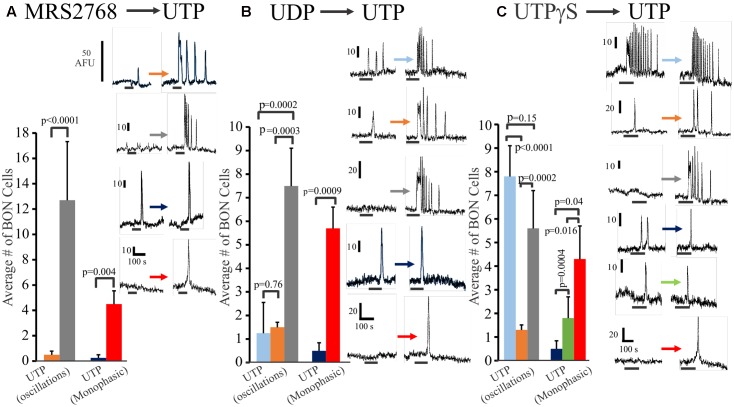
FIGURE 3.
Oscillations or monophasic Ca2+ transients involve P2Y4 and P2Y6 receptors in human BON. Ca2+ responses to consecutive applications of (A) a P2Y2 agonist MRS2768, (B) a P2Y6 agonist UDP or (C) a P2Y2,4 agonist UTPγS followed by UTP (washout of 10 min, drugs tested in 4–5 separate cultures). The color of each column represents a particular type of response that is illustrated in representative Ca2+ transients at the right of each histogram. For example, in (A), the gray bar represents cells with no response to MRS2768 and Ca2+ oscillations to UTP. The red bar represents cells with no response to MRS2768 and a monophasic Ca2+ transient to UTP. UTPγS in contrast to UDP more closely mimics responses to UTP in a significant proportion of cells.

