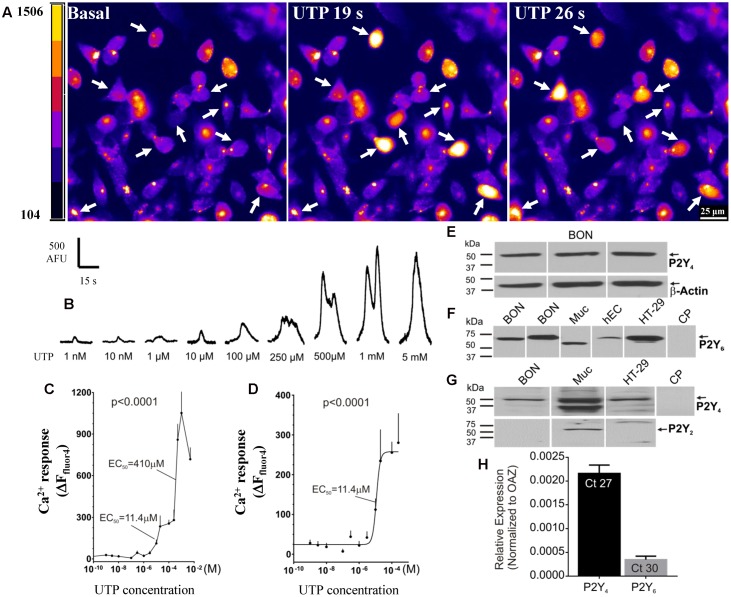
FIGURE 4.
Function and molecular characteristics of uridine nucleotide receptors activated by UTP. (A,B) UTP elicits a concentration dependent Ca2+ response in BON. (A) Representative images of BON cells in response to 100 μM UTP perfusion. Cells responding to UTP with a Ca2+response are marked with an arrow; pseudocolor images based on pixel intensity (0–1500 arbitrary units). (B) Representative Ca2+ transients to separate applications of UTP in the concentration range of 1 nM to 5 mM. (C) Biphasic concentration-response curve to UTP for peak Ca2+ responses. ANOVA, p < 0.0001 (310 cells were analyzed). The apparent EC50 of the first phase of the response is 11.4 μM; the EC50 of the second phase is 410μM. (D) The first phase of the UTP concentration – response curve (0.1 nM–0.2 mM) is fitted with a logistic equation; symbols represent the net increase in Ca2+ response at each time point and the error bars are SEM (n = 15 or more cells at each concentration). (E) Representative western blots (WB) showing immunogenic bands for P2Y4R in BON cells. (F) Representative immunogenic bands for P2Y6R in BON, human mucosa (Muc) and isolated human EC cells from surgical specimens (hEC), and human HT-29 cells. Pre-absorption of the anti-P2Y6R antibody with its immunogenic peptide (CP) blocked the immunogenic bands. (G) P2Y4 is detected in BON, Muc and HT-29 cells. P2Y2R is only detected in the human mucosa and not BON or HT-29. (H) TaqMan PCR analysis showing the relative expression of P2Y4R and P2Y6R normalized to OAZ as 2ˆ(–ΔCt). The Ct values are indicated inside each column, N = 6 cultures. BON cells for qPCR were tested at passage 44, and P2Y4 expression was >P2Y6 expression (see Results and Supplementary Figure 2).

