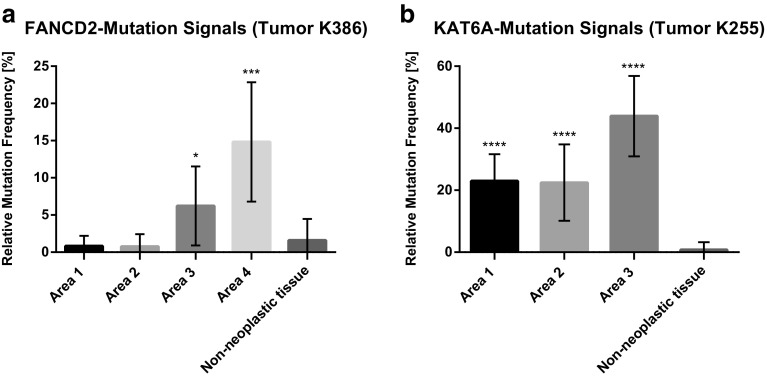
Fig. 3.
In situ mutation detection of FANCD2 and KAT6A mutations in a colorectal tumors. The relative mutation frequency indicates the ratio between wild-type and mutant signals in the respective tissue. a Quantification of transcripts in tumor K386 and b in tumor K255. Each data point represents the mean mutation frequency of ten 20× field of views of the respective tumor area with each field of view comprises >80% tumor content (*p < 0.05, ***p < 0.001, and ****p < 0.0001)

