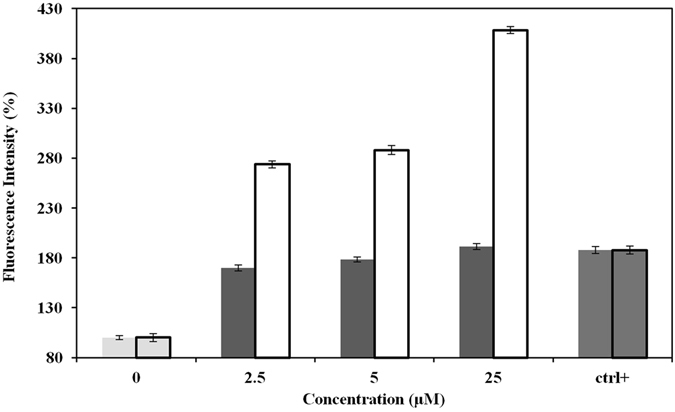
Figure 13.

ROS generation in SNPs ■ and ASNPs □ treated MDA-MB-231 cells. Ctrl+ represents positive control cells, which are treated by H2O2. Relative fluorescence of DCF was measured using a spectrofluorometer with excitation at 485 nm and emission at 530 nm. Each column represents the mean value of three measurements. The error bars were calculated by dividing the standard deviation by the square root of the number of measurements.
