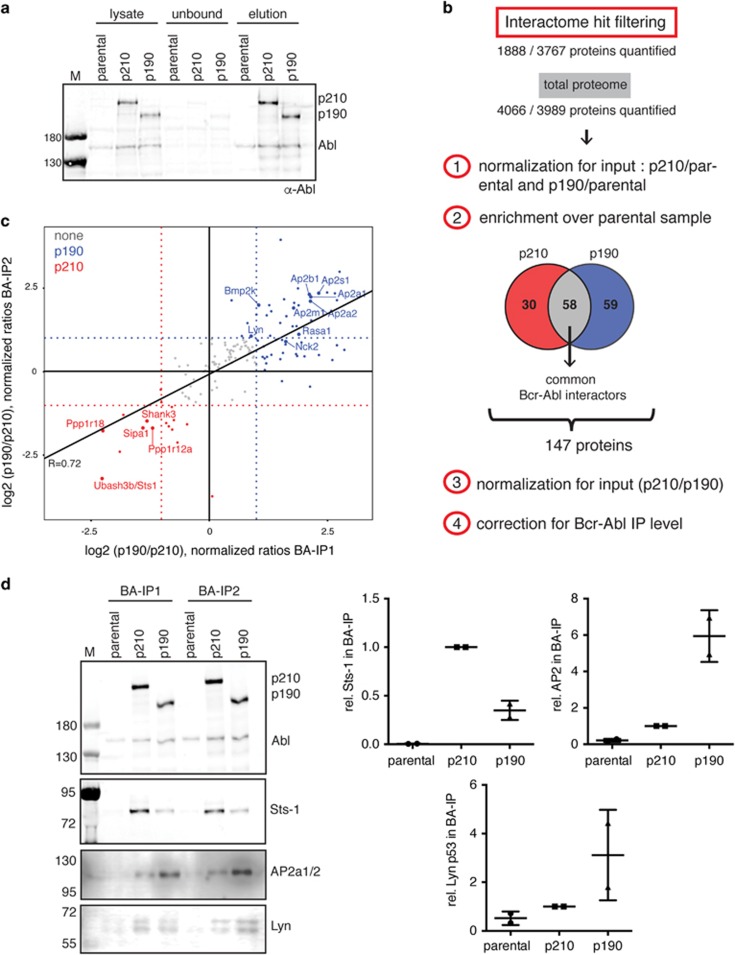
Figure 2.
Analysis of the Bcr–Abl p210 and p190 interactome. (a) Quality control anti-Abl immunoblot after immunoaffinity purification of the Bcr–Abl complexes for a representative experiment. For the lysate samples 50 μg of total protein was loaded and an equivalent volume was used for the unbound fraction. The ratio of the two Bcr–Abl isoforms p210:p190 was 1.4:1 in the eluate, which was in accordance with the quantification by mass spectrometry (Supplementary Figure S1). For the elution fraction, 0.7% of the total SILAC eluate was loaded and quantification of bands enabled the calculation of the immunoprecipitation (IP) efficiency/Bcr–Abl complex recovery of 29% of the input amount. (b) Schematic representation of filtering criteria to select the differential Bcr–Abl interactors. Quantified proteins (1888 and 3767 proteins, respectively) were normalized to their input amounts (4066 and 3989 proteins quantified, respectively) and only those proteins with significant enrichment (according to Significance B) over the parental control were selected. This reduced number of proteins were further normalized for the Bcr–Abl IP amounts and finally selected if differentially enriched by at least twofold. A detailed description of the data analysis workflow is described in the Supplementary Methods. (c) Scatter plot representation depicting the final list of 147 Bcr–Abl interactors (see panel b) with the respective log2 ratios in both experiments (Bcr–Abl (BA) IP1 and IP2) showing an overall good correlation (R=0.72). Those proteins considered differential are colored in red (p210) and blue (p190). Selected proteins are highlighted with bigger dot size and gene name labels. (d) Validation of differential Bcr–Abl interactors by immunoblotting. Elution fractions of both replicates were analyzed corresponding to 0.7% of the total SILAC elution fraction. We chose to validate the interactome hits Ubash3b/Sts1 (enriched in p210) and AP2a1/2 and Lyn (both enriched in p190). The quantified signal after correction for the Bcr–Abl IP amounts is shown on the right side. Individual values are plotted together with the mean±s.d.

