Figure 4.
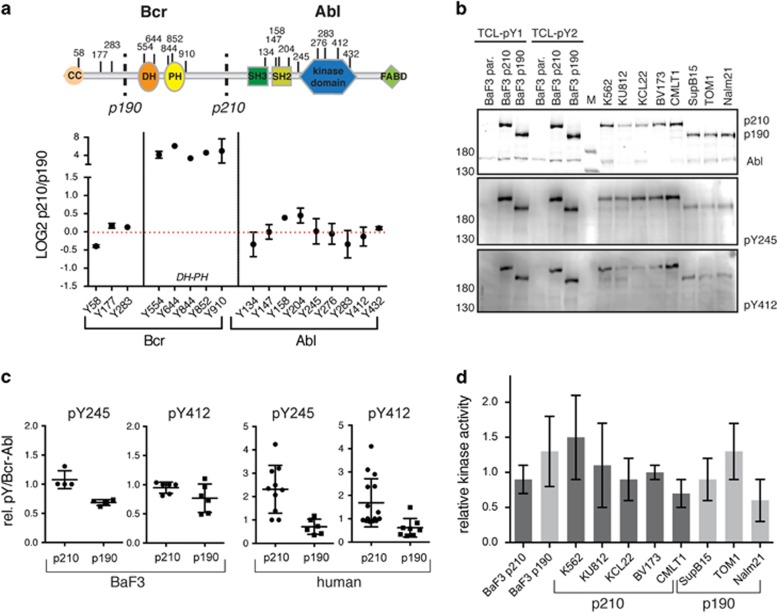
Bcr–Abl p210 and p190 phosphorylation sites and kinase activity. (a) Several Bcr–Abl pY sites were quantified in our phosphoproteome data set. The domain organization and location of the pY sites are shown and the sites are plotted together with their respective log2 ratio between p210/p190. Dots represent mean values ±s.d. Five out of the 17 sites could only be quantified in one experiment. Residues are numbered according to the Bcr and Abl 1b protein numbering. (b) Immunoblot analysis of the two autophosphorylation sites that are important for Abl catalytic activity: pY245 and pY412. Equal amounts of total cell lysates of the indicated BaF3 and human p210 and p190 expressing cell lines were loaded, immunoblotted with the indicated antibodies and quantified (see (c)). Note that only Bcr–Abl is phosphorylated on Y245 and Y412, while Abl is not or only very weakly phosphorylated on these sites. (c) Quantified pY245 and pY412 immunoblot signals (from panel (b)) after normalization to the total Bcr–Abl protein in BaF3 (left two graphs) or human cell lines (right two graphs). Individual values are plotted together with the mean±s.d. (d) Bcr–Abl was immunoprecipitated from the indicated BaF3 and human p210 and p190 cell lines and a radioactive in vitro kinase activity was performed measuring phosphotransfer to an optimal Abl substrate peptide. Each kinase assay was run in triplicate for each immunoprecipitate and the resulting averaged activity value was normalized to the Bcr–Abl amount determined by immunoblot analysis. The bar graph shows the mean±s.d. from three biological replicates.

