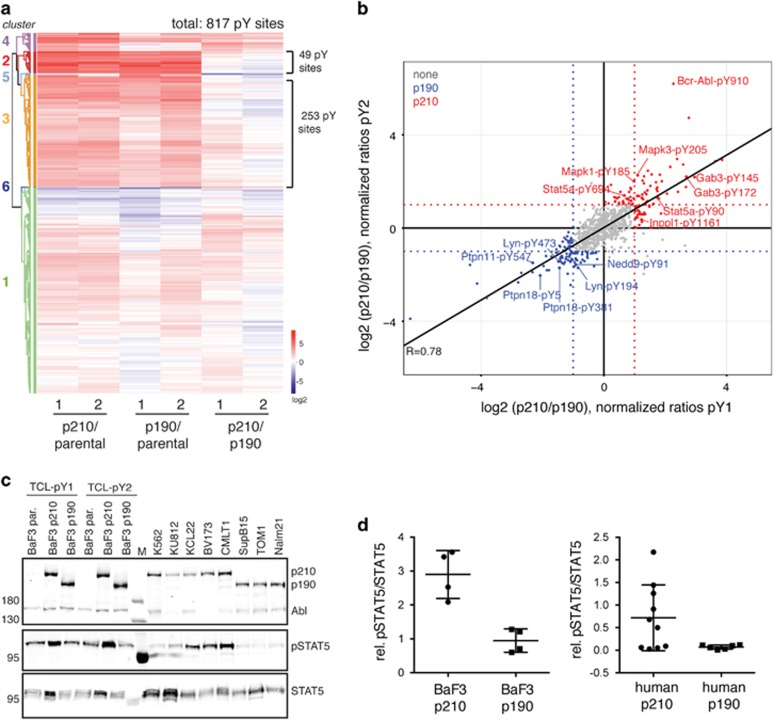
Figure 5.
Bcr–Abl pY phosphoproteome. (a) Heatmap representation of the 817 quantified phosphosites and their respective ratios in the comparison of the three samples: BaF3 parental, BaF3 p210 and BaF3 p190. The two biological replicates are plotted next to each other. The six clusters identified by unsupervised hierarchical clustering are highlighted. (b) Scatter plot for the normalized log2 ratios between the p210 and p190 Bcr–Abl samples (without correction for the total protein levels) in both biological replicates (pY1 and pY2). Each dot is representative of a phosphopeptide. Those pY sites considered as differential are colored in red (p210) and blue (p190). Selected phosphorylation sites are labeled. (c, d) Immunoblot validation of Stat5 pY694 using the BaF3 and human cell line panel. The quantified signals of two technical replicates were normalized to the total Stat5 protein and individual values are plotted together with the mean±s.d.

