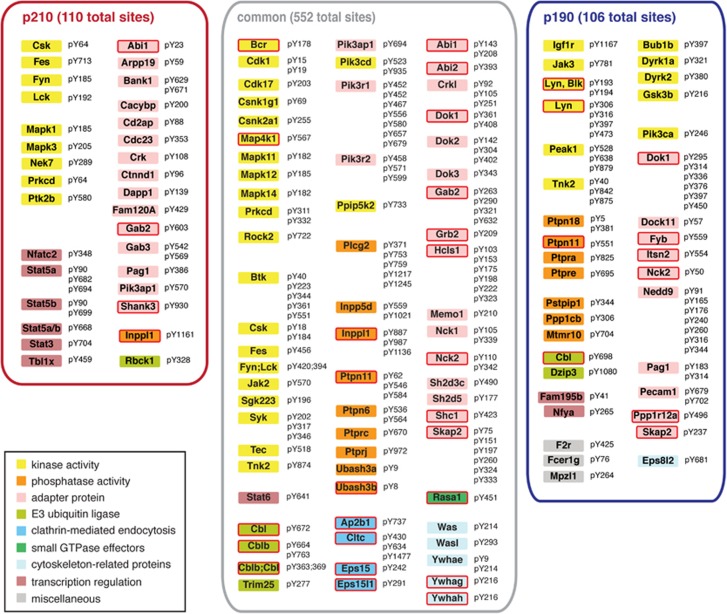
Figure 6.
Selected phosphorylation events of p210 and p190 Bcr–Abl. A selection of differential and common Bcr–Abl phosphorylation sites that were found in the pY data set is shown. The complete data set is listed in Supplementary Table S6. Boxes around the individual proteins are color-coded according to their function and a red frame indicates that a protein was also found in the interactome analysis.

