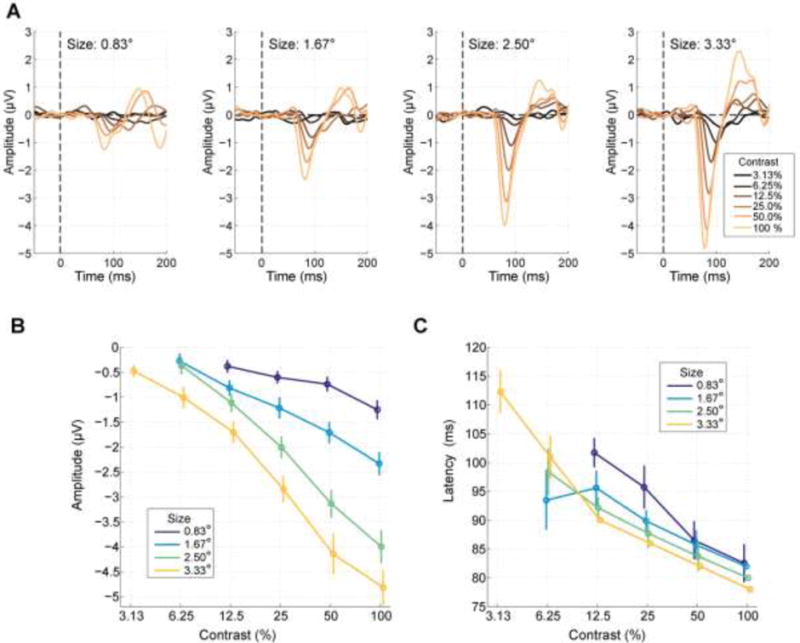
Figure 4. C1 component variation as a function of size and contrast.

A) Visual evoked potential waveforms for each size and contrast. Amplitude clearly increased with both contrast and size. B) The contrast response function of C1 peak amplitude exhibited a monotonic increase in negative potential with increasing stimulus diameter and contrast. Conditions for which a reliable C1 component was not elicited are omitted. Error bars reflect the standard error of the mean across subjects, estimated through a Jackknife procedure. C) C1 peak latency increased strongly with decreasing contrast, and stimulus size.
