
Figure 5. C1 component amplitude varied sub-quadratically as a function of stimulus diameter.
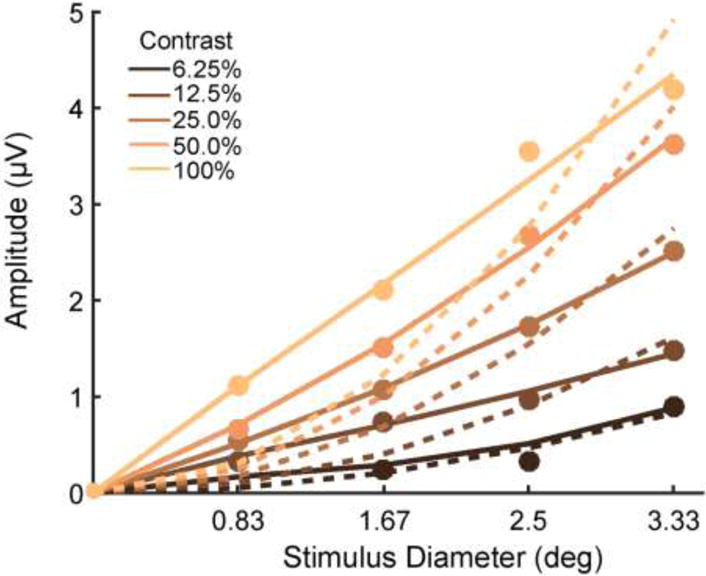
Filled circles mark real data points reflecting average C1 amplitude in 20-ms time windows centered on grand-average peak latency. Solid lines show the best fitting function of the form y = AxB with both A and B free to vary. Dashed lines show the best fits of the function with B constrained to be equal to 2, as would be the case if C1 amplitude increased linearly with stimulus area.