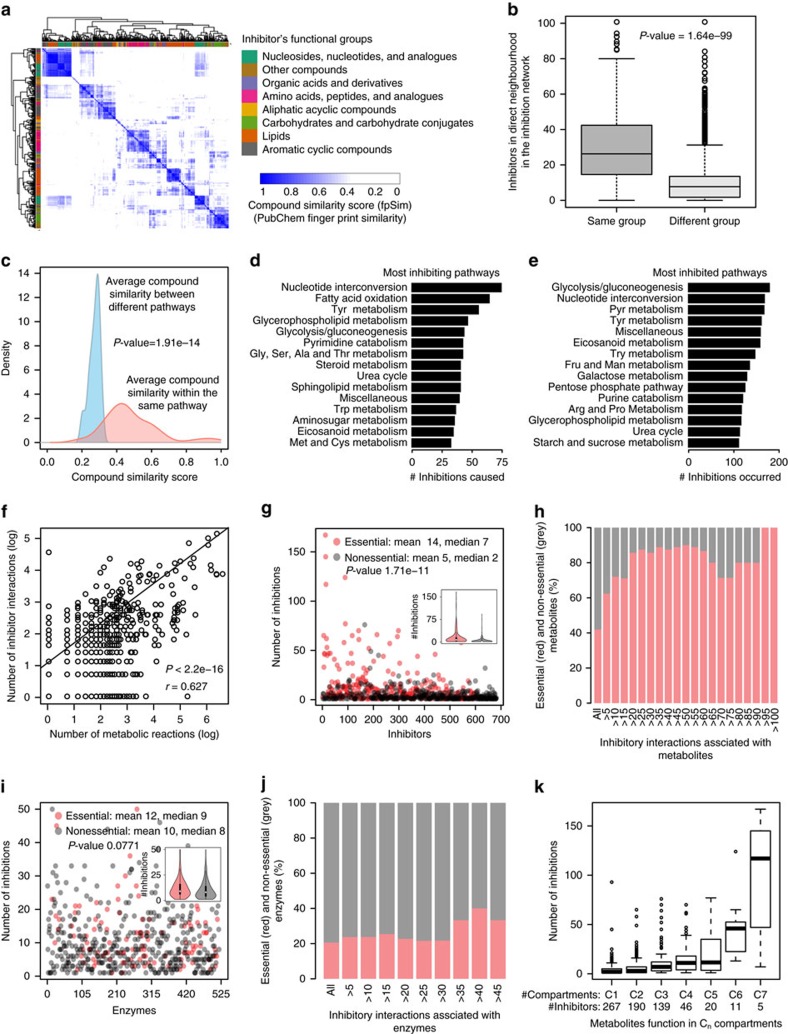
Figure 4. Inhibitors emerge in the metabolic neighbourhood of enzymes and are often the essential and most central metabolites.
(a) Human metabolites grouped according to the HMDB superclass upon pairwise compound structural comparisons by fingerprint similarity (fpSim). (b) Inhibitors neighbour other inhibitors of the same HMDB group in the inhibition network. (c) Metabolites of the same metabolic pathway as the enzyme’s substrates possess significant structural similarity, rendering them the most likely inhibitors. (d) Fifteen top most inhibiting pathways in the inhibitor network. (e) Fifteen top most inhibited pathways (full list in Supplementary Data 1). (f) The number of inhibitory interactions and number of metabolic reactions per metabolite correlate across the metabolic network. (g) Metabolites participating in an essential biochemical reaction significantly inhibit more enzymes. (h) Vice versa, essentiality increases with degree of inhibition, and all of the most frequent inhibitors are essential metabolites. (i) The same is not the case for enzymes; essential and nonessential enyzmes are similarly frequently inhibited; (j), and enzyme essentiality remained constant with the increase in degree of inhibition. (k) Metabolites that function in multiple organelles (that is: Cn: metabolite participates in enzymatic reactions in n compartments) inhibit more reactions. P values were calculated using Welch two sample t-test (b,c,g,i) or Pearson’s product–moment correlation (f).

