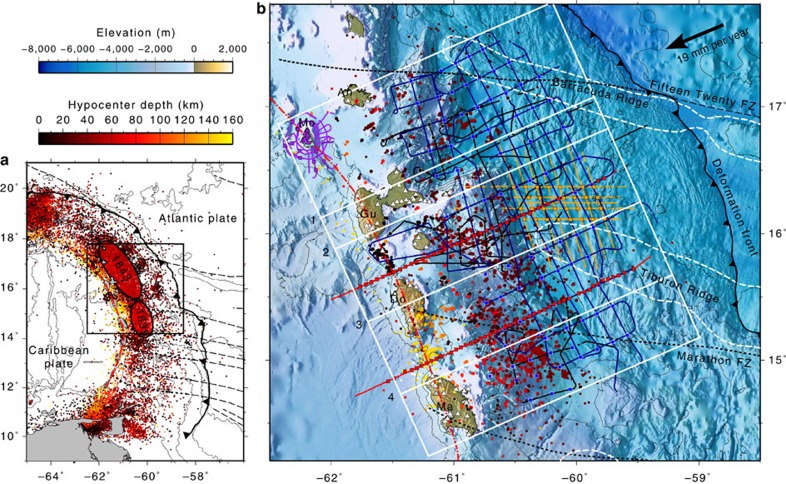
Figure 1. Study region and data distribution.
(a) Location of study area in the Lesser Antilles subduction zone. The seismicity from 1900 to 2015 from the ISC catalogue is marked by coloured dots. Ellipses mark the estimated rupture areas of the 1843 and 1839 earthquakes15. (b) Survey geometry with bathymetry of the study area. Small circles, colour-coded for depth, mark earthquake hypocenters used in this study. Smaller circles mark events that were relocated but were not used in the tomography. Coloured lines mark airgun shooting profiles from different surveys: EW9803 (orange), Sismantilles 1 (black), TRAIL (red), Sismantilles 2 (blue) and SEA-CALIPSO (purple). Triangles mark land stations. Squares mark OBSs. White dashed lines mark the outlines of the Barracuda and Tiburon ridges. Black dashed lines mark the projection onto the plate interface of the approximate prolongation of the main recognized fracture zones. The white box marks the extent of the tomography model. Numbered white lines mark the locations of profiles shown in Fig. 4. Topography and bathymetry data for this image were compiled from multi-beam bathymetry data21,69, the GEBCO_2014 Grid, version 20150318 (www.gebco.net), and data from the ASTER Global Digital Elevation Model (GDEM) v2 (ref. 70).

