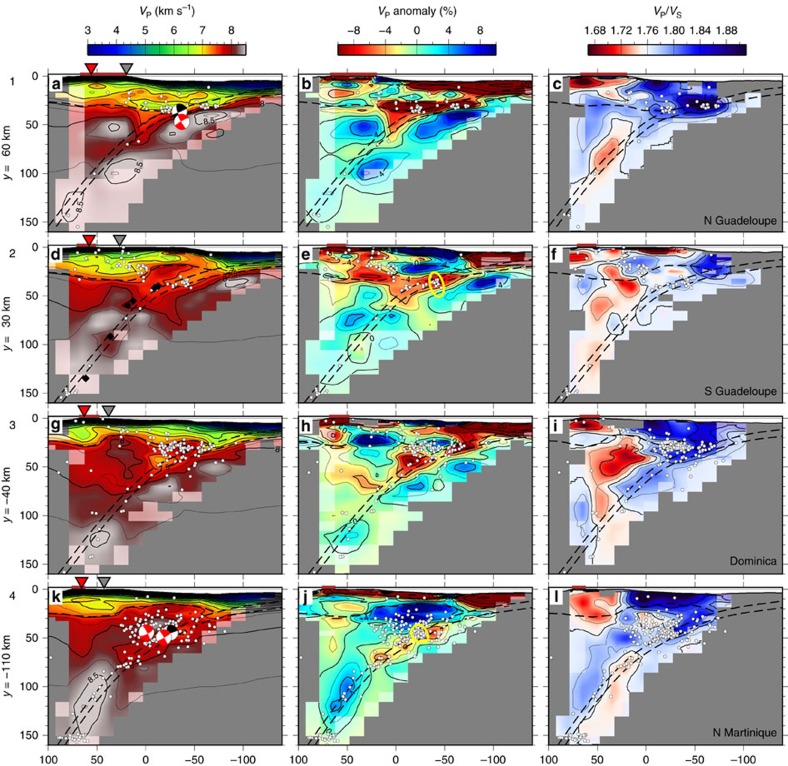
Figure 4. Cross sections trough the final tomography model.
(a,d,g,k) VP. (b,e,h,j) VP anomaly with respect to 1D model. (c,f,i,l) VP/VS ratio. Rows correspond to different profiles with locations shown in Figs 1b and 5. Dashed lines mark the interpreted location of the oceanic basement (slab top surface), the slab Moho (assuming a crustal thickness of 7 km) and the overriding plate Moho. Notice the clear slab crust low-VP anomaly and the deeper mantle wedge seismicity in the southern profile. Areas with sparse ray coverage are covered in grey. Areas with potential strong smearing are faded. Earthquake hypocenters within 15 km of each section are marked by white circles (all relocated events). Black and white focal mechanisms are shown for relocated flat thrust events. Red focal mechanisms correspond to non-relocated events from the CMT catalogue. The black diamonds in d mark the depth of the slab surface estimated from receiver functions24. The yellow ellipses in e,j mark dipping planar clusters of earthquakes. These are more easily identified in Supplementary Movies 1 and 2, which show a 3D rotating view of the earthquake distribution. The inverted triangles mark the location of the active volcanic arc (red) and the ancient volcanic arc (grey).

