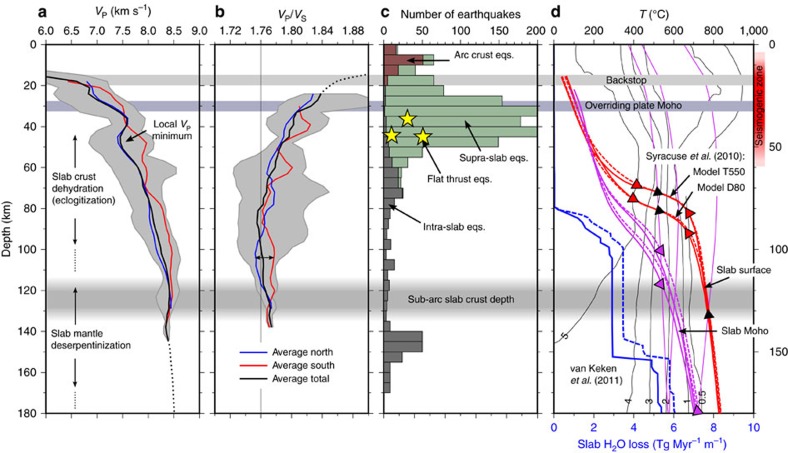
Figure 6. Earthquakes distribution and slab dehydration.
(a) Average P-wave velocity and (b) VP/VS along the slab surface. We show the average for the whole model (black) and the average profiles for the regions north (blue) and south (red) of the Marathon fracture zone. The grey area represents one s.d. from the mean. (c) Depth distribution of local earthquakes. We distinguish crustal earthquakes beneath the arc from supra-slab earthquake and intra-slab earthquakes. Yellow stars mark the depth of flat thrust earthquakes located on the plate interface. (d) Predicted temperature on the LASZ slab surface (red) and slab Moho (purple)56 and expected water loss from the slab assuming a MORB crust and serpentinized slab mantle57 (blue). Dashed lines: southern LASZ; continuous lines: northern LASZ. In the background we show the maximum wt% water content bound in minerals for MORB56 (thin black lines) and the major dehydration reactions for hydrated peridotite3 (thin purple lines). Red triangles mark the depth interval of expected water release from dehydration of MORB in the slab crust. Purple triangles mark the expected dehydration of the slab mantle. Black triangles mark the expected dehydration of tectonized slab crust (containing a significant proportion of serpentinized peridotite).

