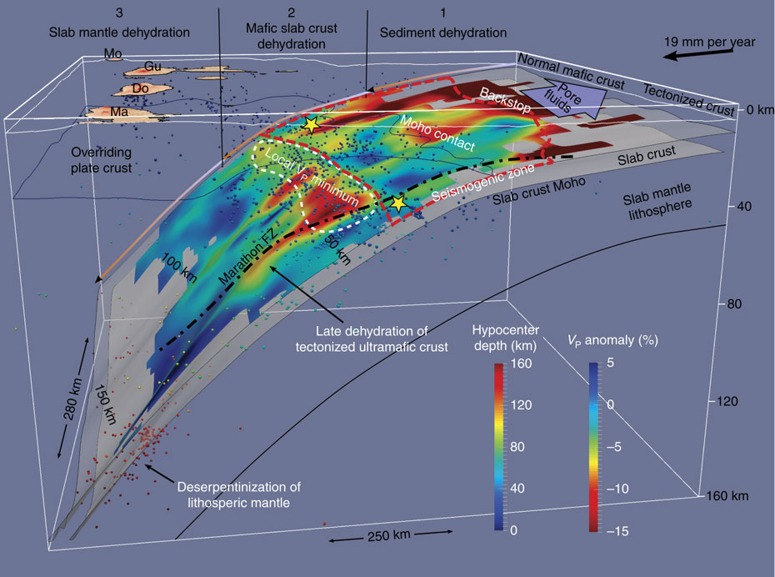
Figure 7. Representation of the three stages of slab dehydration.
The VP anomaly (same as Fig. 5b) is draped over the slab surface. Local earthquakes are marked by coloured dots. The location of the local VP minimum near 50 km depth is highlighted by a dashed white line. The slab crust Moho is drawn assuming a 7 km crustal thickness. Yellow stars represent the hypocenters of large thrust earthquakes. The proposed extent of the seismogenic zone is marked by a red dashed line. Notice how the mantle wedge seismicity spatially correlates with the local VP minimum and how intra-slab seismicity is enhanced near the fracture zone. See Fig. 5 caption for further display information. A rotating animation of the slab viewable in 3D is presented in Supplementary Movies 1 and 2.

