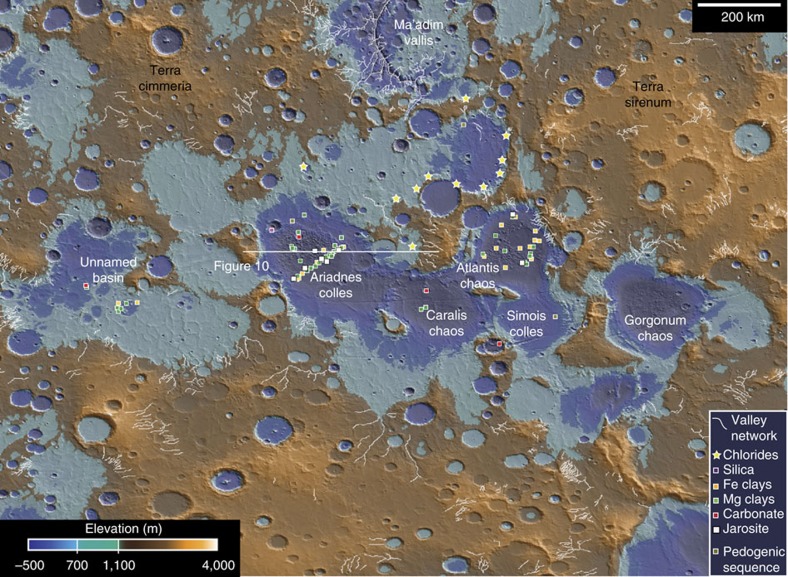
Figure 5. Topography and mineralogy of Eridania basin.
MOLA topographic data are colourized to show the maximum (1,100 m) and minimum (700 m) level of an ancient sea. Alteration minerals represent phases detected in this study using CRISM data with the exception of ‘chlorides,’ which were detected previously using THEMIS data. Deep basin units are pervasively altered to Fe- and Mg-rich clay minerals, and likely sulphides, which are traced by the occurrence of jarosite.

