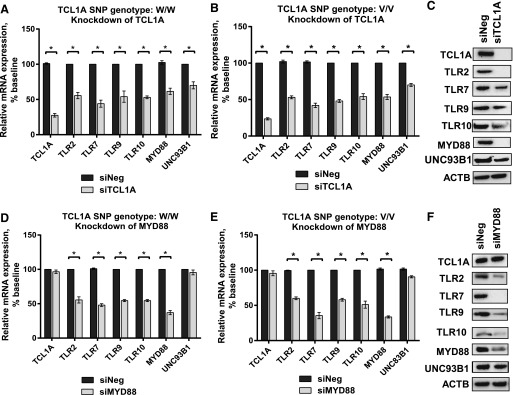
Fig. 4.
TCL1A could modulate TLR2, TLR7, TLR9, TLR10, MYD88, and UNC93B1 expression in LCLs. Relative mRNA expression (A and B) of TCL1A, TLR2, TLR7, TLR9, TLR10, MYD88, and UNC93B1 after knockdown of TCL1A in LCLs with known TCL1A SNP genotypes using pooled siRNA. Eight cell lines of each genotype were used in these experiments. *P < 0.05. Student’s t test was performed to compare gene expression in LCLs with differing TCL1A SNP genotypes before and after gene knockdown, *P value ≤ 0.05 was considered statistically significant. All values are mean ±S.E.M for three separate independent assays. Protein expression was determined by Western blot analysis (C). Relative mRNA expression (D and E) of TCL1A, TLR2, TLR7, TLR9, TLR10, MYD88, and UNC93B1 after knockdown of MYD88 in LCLs with known TCL1A SNP genotypes using pooled siRNA. (F) Western blot analysis was performed for TCL1A, TLR2, TLR7, TLR9, TLR10, MYD88, and UNC93B1 after knockdown of MYD88.

