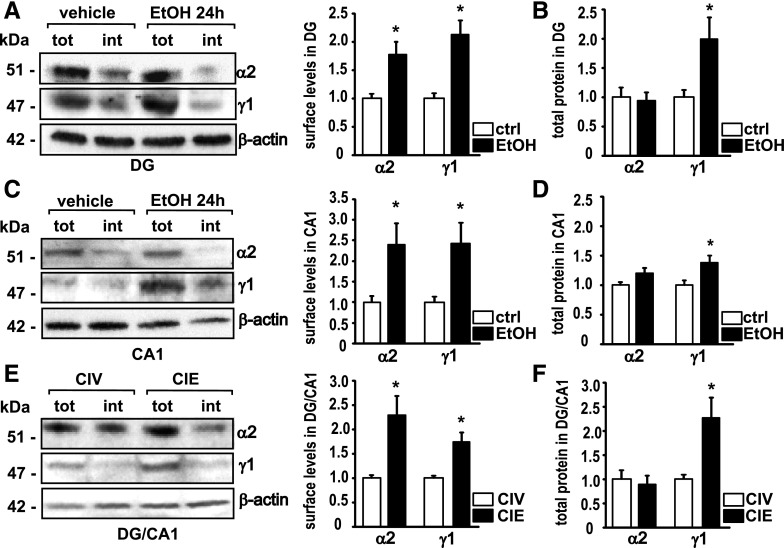
Fig. 2.
Administration of acute and chronic EtOH induces an increase in GABAAR α2 and γ1 subunit surface levels. (A) Representative Western blots for α2, γ1, and β-actin after cell-surface cross-linking (left) and quantification (right) 24 hours after a single intoxicating dose of EtOH in the DG. MANOVA, Wilks’ λ = 0.226, P = 0.0055, n = 5. tot, amount of total protein; int, amount of internal protein. (B) Quantification of the total amount of α2 and γ1 protein measured in DG 24 hours after EtOH intoxication. Wilks’ λ = 0.554, P = 0.126, n = 5. ctrl, control. (C) Representative Western blots for α2, γ1, and β-actin after cell-surface cross-linking (left) and quantification (right) 24 hours after a single intoxicating dose of EtOH in the CA1. Wilks’ λ = 0.443, P = 0.0255, n = 6. (D) Quantification of the total amount of α2 and γ1 protein measured in CA1 24 hours after EtOH intoxication. Wilks’ λ = 0.478, P = 0.0754, n = 5. (E) Representative Western blots for α2, γ1, and β-actin after cell-surface cross-linking (left) and quantification (right) after CIE in the DG + CA1. Wilks’ λ = 0.246, P = 0.0073, n = 5. (F) Quantification of the total amount of α2 and γ1 protein measured after CIE in DG + CA; tot, total amount of protein; int, intracellular protein content. Wilks’ λ = 0.457, P = 0.141, n = 4. Controls are set as 1.0%. Data are mean ± S.E.M. *Significant difference (P < 0.05, calculated within the MANOVA model) between the treatment versus the control.

