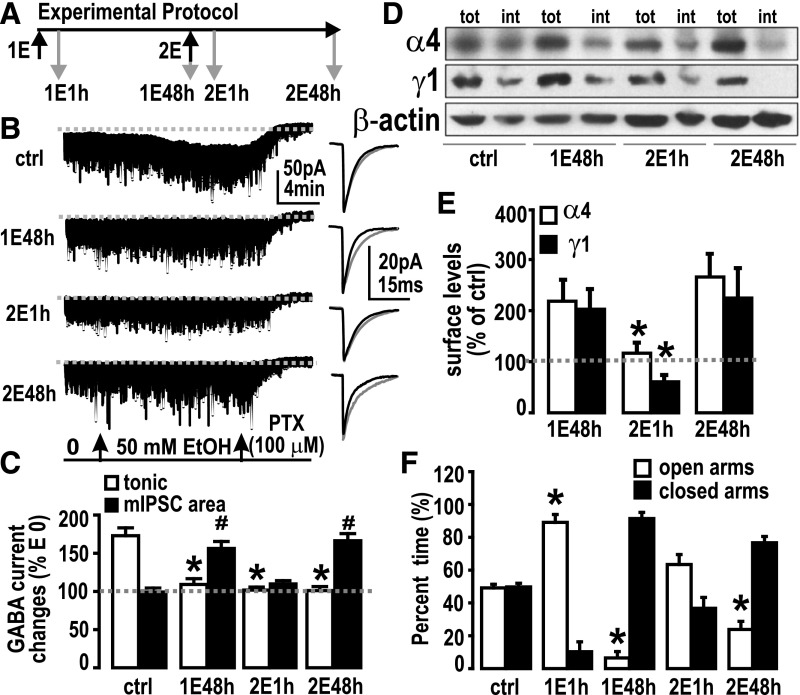
Fig. 4.
A second pulse of EtOH reveals further changes in GABAAR physiology, pharmacology, and plasticity, correlated with anxiety-like behavior. (A) “Two-pulse” experimental protocol. Treatment regimen is indicated by black arrows. 1E: First EtOH oral gavage (5 g/kg); 2E: second EtOH gavage. Gray arrows show time points when patch-clamp recordings from DGCs in slices were performed. 1E1h: 1 hour after first EtOH gavage; 1E48h: 48 hours after first EtOH; 2E1h: 1 hour after second EtOH gavage; 2E48h: 48 hours after second EtOH. (B) Effects of acute EtOH (50 mM) applied in the recording chamber on Itonic and mIPSCs. High chloride (135 mM CsCl, refer to Materials and Methods section) patch solution was used. The cells were whole-cell voltage-clamped at −70 mV. Gray dashed line is the basal Itonic level after picrotoxin (PTX, 100 μM) application. Representative recordings are shown (left) with the averaged mIPSCs (right) before (black trace) and during (gray trace) EtOH perfusion. ctrl, control (drinking water). (C) Summary of acute EtOH-induced changes in Itonic and mIPSCs. Gray dashed line represents E0 (set as 100%). *P < 0.05, significant difference between EtOH treatment versus control in Itonic; #, P < 0.05, significant difference between EtOH treatment versus control in mIPSC area (n = 5 or 6/group), one-way ANOVA followed by Dunnett’s multiple comparison method comparing three treatment groups with one control group. (D) Representative Western blots for GABAAR α4 and γ1 subunits with their β-actin signals (all from the same blot) after cell-surface cross-linking from control (ctrl), 1E48h, 2E1h, and 2E48h. tot, amount of total protein; int, amount of internal protein. (E) Quantification of surface levels measured by cross-linking experiments. Data are mean ± S.E.M., n = 4–10 rats. *P < 0.05 significant decrease versus 1E48h and 2E48h, one-way ANOVA, followed by Holm-Sidak’s (pairwise) multiple comparisons test. (F) Anxiety assayed by elevated plus maze (EPM, n = 6/group). Open bars are the time rats spent in open arms (% of total 5-minute monitor time); solid bars are the time spent in closed arms in respective treatment groups. *P < 0.05; time spent in open arm of EtOH treatment groups versus control group (drinking water), one-way ANOVA followed by Dunnett’s multiple comparison method comparing the four treatment groups with a single control. Note that % time spent in the closed arms is complementary to that in the open arms. Significant % time increase in open arms is equivalent to significant % time decrease in closed arms. Therefore, we omitted statistical tests on time spent in closed arms.

