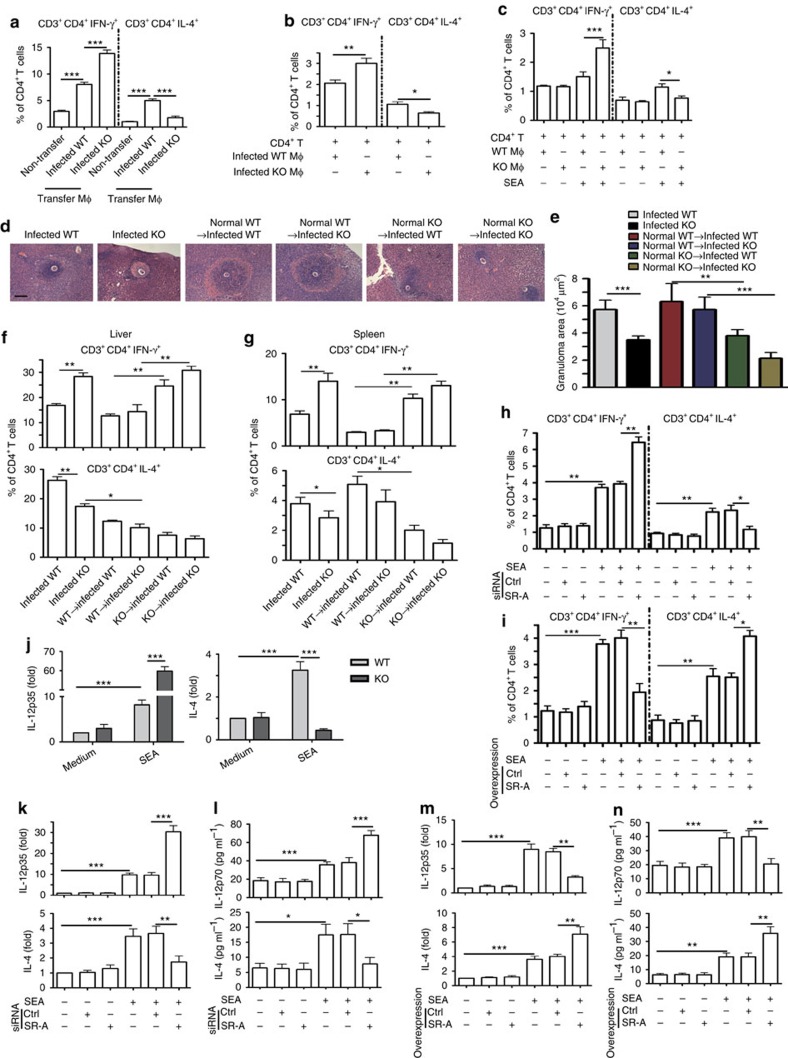
Figure 4. SR-A suppresses M1/Th1 but induced M2/Th2 polarization.
(a) Two weeks after adoptive transfer of infected mice derived peritoneal macrophages to normal WT mice, Th1 or Th2 cells in recipient mouse splenocytes were analysed. Data are expressed as the mean±s.d. of 12 mice from two independent experiments, ***P<0.001 (ANOVA/LSD). (b) CD4+ T cells from control WT mice were purified, and then co-cultured with purified peritoneal macrophages from infected WT or SR-A-deficient mice. Percentages of Th1 or Th2 cells after co-culture for 48 h were analysed by FACS. (c) CD4+ T cells from control WT mice were co-cultured with purified peritoneal macrophages and SEA, and then analysis of Th1 and Th2 cells. (d–g) Four weeks after adoptive transfer of normal WT or SR-A-deficient mice derived peritoneal macrophages to infected WT or SR-A-deficient mice. (d,e) Paraffin-embedded liver sections stained with H&E. Scale bars, 100 μm. For each mouse, the sizes of 30 liver granulomas around single eggs were quantified with AxioVision Rel 4.7. The statistical results of Th1 and Th2 cells by FACs in the liver (f) or spleen (g) of recipient mouse were shown. Data are expressed as the mean±s.d. of six mice for each group, and the experiments were repeated twice with similar results. *P<0.05, **P<0.01, ***P<0.001 (ANOVA/LSD). (h) FACS analysis of Th1 and Th2 cells by BMDMs from control WT mice transfected with siRNA targeting SR-A (si-SR-A) or nontargeting siRNA (ctrl-siRNA) and co-culture with WT CD4+ T cells and SEA. (i) FACS analysis of Th1 and Th2 cells by BMDMs from control WT mice transfected with pcDNA3.1-MSR (SR-A) or empty vector (pcDNA3.1) and co-culture with WT CD4+ T cells and SEA. (j) IL-12p35 or IL-4 mRNA in peritoneal macrophages with or without SEA stimulation. IL-12 or IL-4 expression after BMDMs transfected with si-SR-A or ctrl-siRNA and SEA stimulation by RT-PCR (k) or ELISA (l). RT–PCR (m) or ELISA (n) analysis of IL-12 or IL-4 in BMDMs transfected with pcDNA3.1-MSR (SR-A) or empty vector (pcDNA3.1) and SEA stimulation, data are expressed as the mean±s.d. from three independent experiments, ***P<0.001, **P<0.01, *P< 0.01 (ANOVA/LSD).

