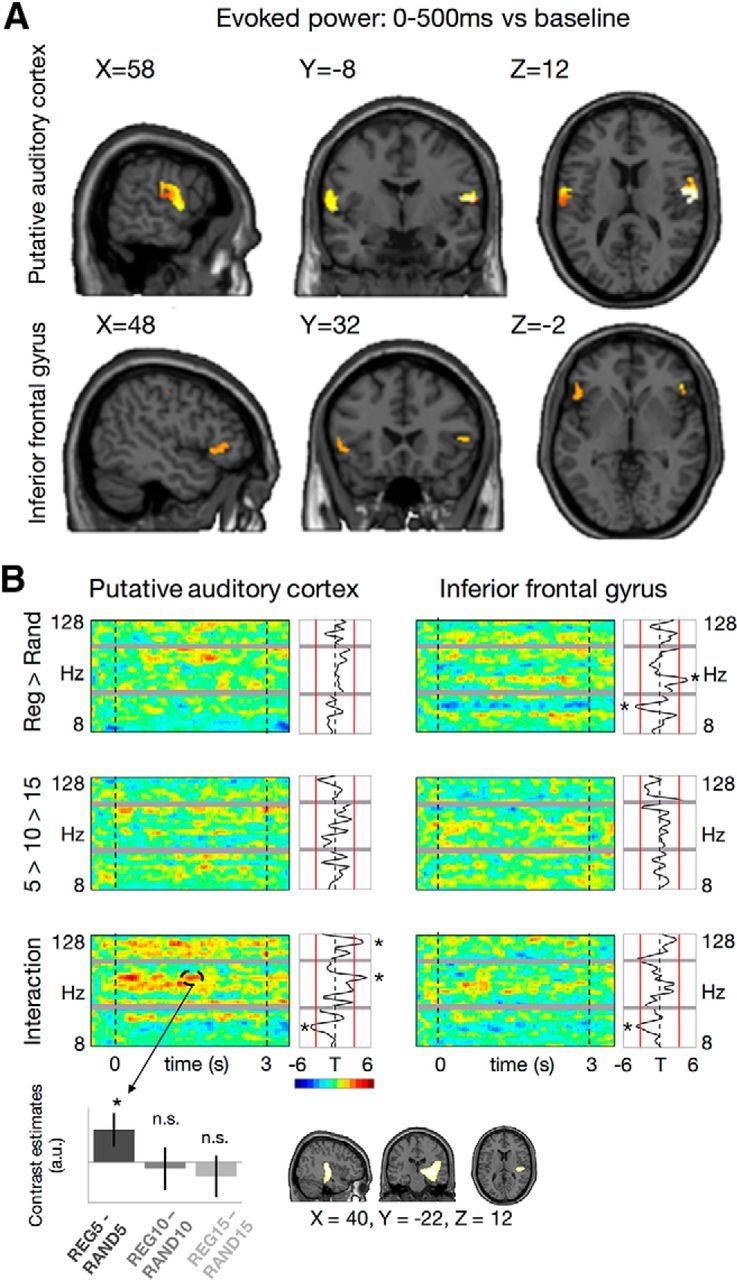
Figure 3.

A, Source reconstruction. Sources of strongest activity evoked by the onset of the auditory sequences were localized to bilateral putative auditory and inferior frontal cortices. B, Source-level time-frequency contrasts. Each panel shows t statistics as time-frequency maps (large panels; highlighted cluster exceeds corrected significance threshold at FWE = 0.05) and time-averaged frequency spectra (small panels; red lines: thresholds of significance at FWE = 0.05). Gray bars indicate notch filter and harmonic. Bar plot inset shows post hoc t tests and 95% confidence intervals for the significant time-frequency cluster showing an interaction of regularity and alphabet size on induced power in auditory cortex (82 Hz, 1500 ms), dominated by the difference in high-frequency power between REG5 and RAND5 conditions. Source activity inset shows that the high-frequency interaction effect at 1500 ms can be specifically assigned to early auditory regions in a whole-brain analysis. Asterisks mark significance after FWE correction.
