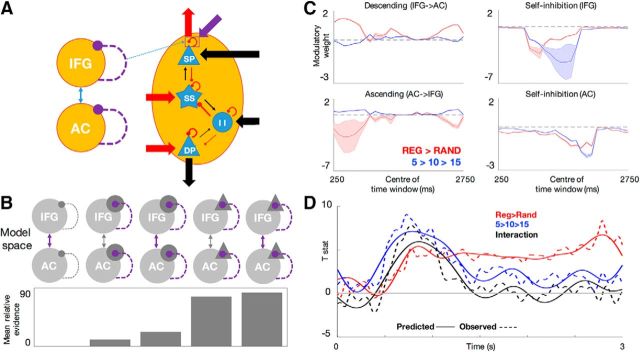
Figure 4.
A, Basic model architecture of a two-source DCM (left) and a canonical microcircuit used to model the responses of each source (right), comprising four neuronal populations (SP, DP, SS, II) characterized by excitatory (black) and inhibitory (red) connections between populations (thin arrows), gain parameters (self-inhibitory connections), as well as sending and receiving connections to and from different regions (thick arrows; arrow width represents prior connection strength). Modulatory connections (here, superficial pyramidal gain) are shown in purple. B, Five alternative models of connections modulated by alphabet size and regularity (extrinsic connections only; inhibitory interneuron gain; extrinsic connections and inhibitory interneuron gain; superficial pyramidal gain; extrinsic connections and superficial pyramidal gain) were compared against one another. Bottom, Log-model evidence (averaged across time windows), relative to the weakest model. C, Time courses of modulatory parameters. Red indicates modulation by sequence regularity (relative to a RAND baseline); blue indicates modulation by alphabet size (relative to an R5 baseline); shaded areas indicate 95% confidence intervals. The predictive effects of alphabet size in RAND are described by the modulatory effects of alphabet size, relative to a RAND5 baseline. However, the predictive effects of alphabet size in REG are due to cumulative effects of both REG > RAND and alphabet size. D, DCM parameters as predictors of the sensor-level effects. Sensor-level effects of regularity and alphabet size as observed (dashed lines) and predicted by the DCM parameters (solid lines). Please note that the observed sensor-level effects correspond to those shown in Figure 2B, after low-pass (<8 Hz) filtering the data.

