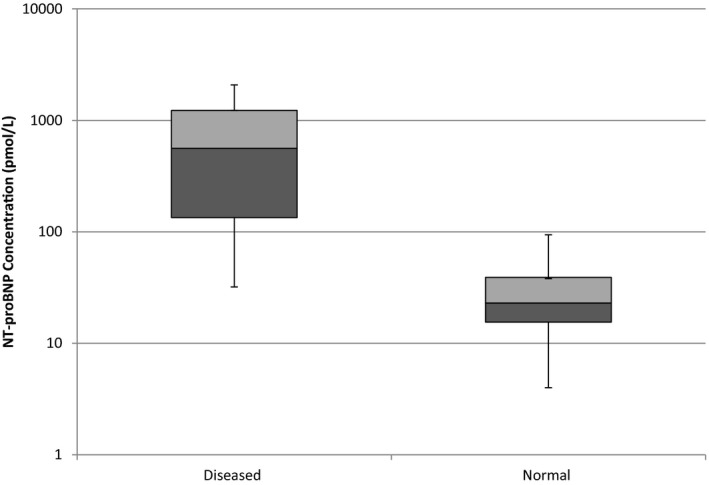
Figure 2.

Box and Whisker plot of N‐terminal prohormone of brain natriuretic peptide (NT‐proBNP) concentration by a second‐generation NT‐proBNP quantitative ELISA assay in 26 adult cats with cardiac disease and 27 normal adult cats. The boxes encompass the interquartile range, and the line within the box denotes the median value. Note the use of a log scale on the y‐axis.
