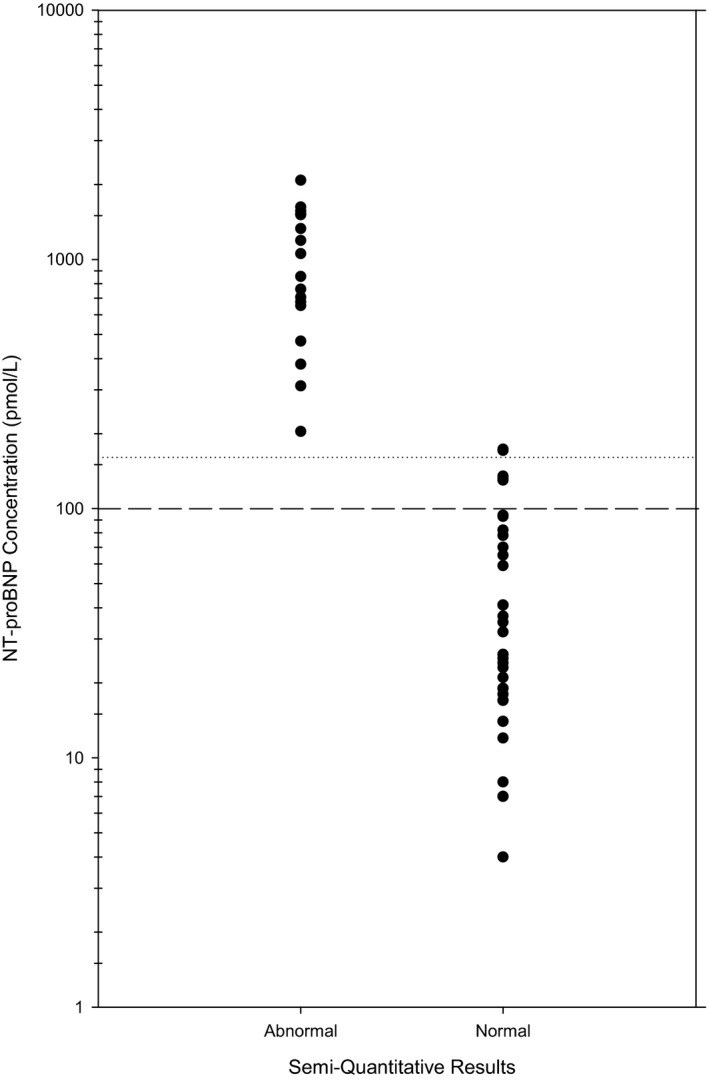
Figure 3.

N‐terminal prohormone of brain natriuretic peptide (NT‐proBNP) concentration measured by a second‐generation NT‐proBNP plate assay from 36 cats with a negative visual assessment of a point‐of‐care NT‐proBNP SNAP ELISA and from 17 cats with a positive visual assessment. The dashed line represents the upper end of the reference interval for the NT‐proBNP plate assay in cats (100 pmol/L). The doted line represents the lower end of the range at which the SNAP ELISA is expected to turn abnormal (150 pmol/L). Note the use of a log scale on the y‐axis.
