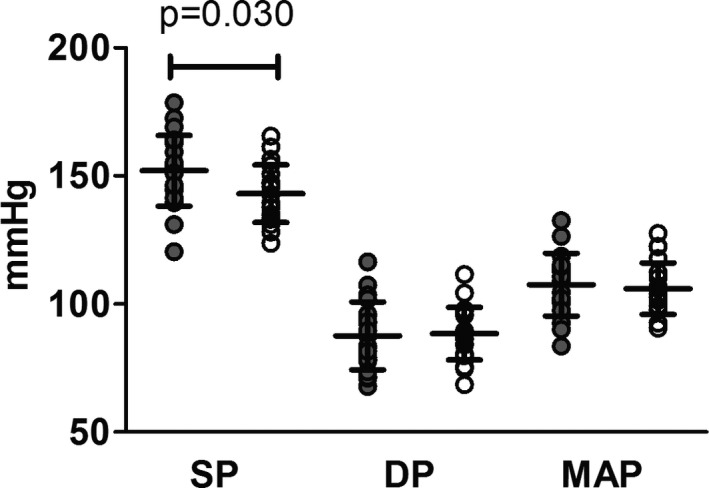
Figure 2.

Systolic pressure (SP), diastolic pressure (DP), and mean arterial pressure (MAP) in Greyhound and non‐Greyhound dogs. Greyhounds had significantly higher SP compared to non‐Greyhounds (*P = .030). There was no significant difference between groups for DP or MAP. Filled circles represent Greyhounds, and open circles represent non‐Greyhounds.
