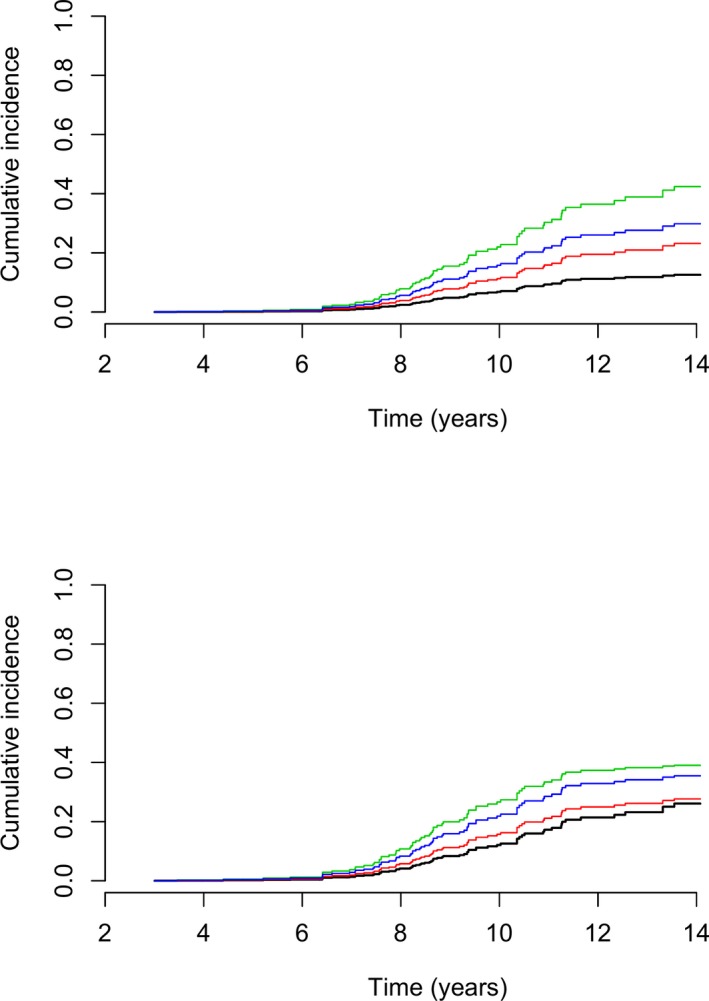
Figure 4.

Cumulative incidence curves for cardiac death given for each combination of sex (top = females, bottom = males) and mitral regurgitation (MR) group where black curve represents no MR = 0%, red curve represents mild MR (<20%), green curve represents moderate (20–50%)‐severe (>50%) MR, and blue curve represents intermittent MR (most often mild MR but some MR jets ≥ 20%). The remaining variables are set at their median values (LVIDSN = 0.93, LA/Ao = 1.2, and HR = 120).
