Figure 1.

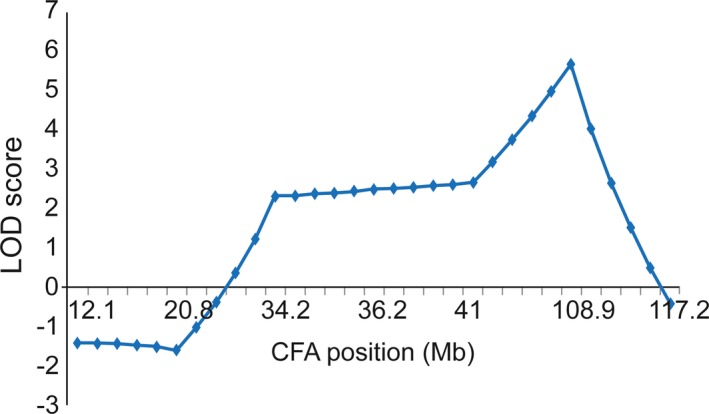
A plot of LOD score on CFA X. Y‐axis is the LOD score, and x‐axis is the position on CFA X in Mb. The significant LOD score (>3) region is located between 41 and 117.2 Mb with the highest LOD score of 5.6 at 103.9 Mb.

A plot of LOD score on CFA X. Y‐axis is the LOD score, and x‐axis is the position on CFA X in Mb. The significant LOD score (>3) region is located between 41 and 117.2 Mb with the highest LOD score of 5.6 at 103.9 Mb.