
Figure 3.
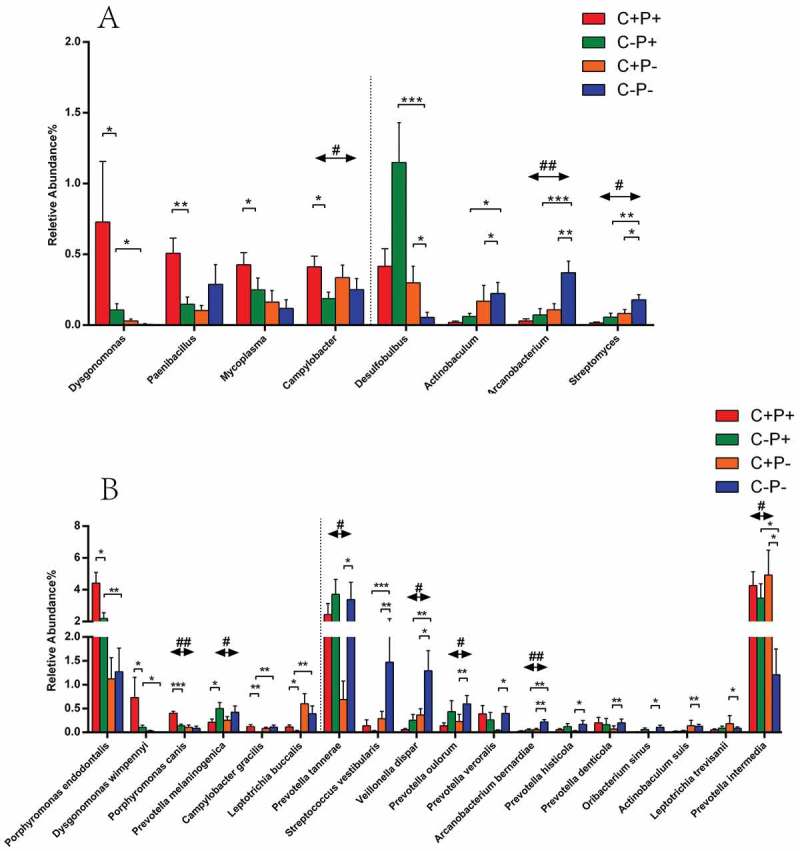
Mean relative abundance of bacterial genera (A) and species (B) with statistical differences between COPD and non-COPD patients. Data from COPD patients (C+P+ and C+P−) and non-COPD patients (C−P+ and C−P−) are shown. The abundance cut-off was set at 0.1%. Some values <0.1% were not calculated or shown in the figure. Statistical significance is indicated by the following: #p < 0.05, significant difference between COPD and non-COPD patients using weighted Student’s t-tests; ##p < 0.01; ###p < 0.001; *p < 0.05; **p < 0.01; ***p < 0.001.