
Figure 1.
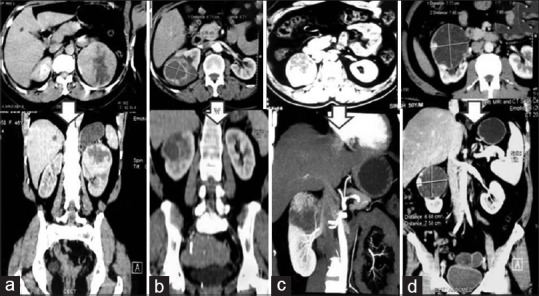
Representative computerized tomography images showing tumors with high RNSs. From left to right: (a) RNS = 11; (b) RNS = 11; (c) RNS = 10 and (d) RNS = 10. Above arrow - transverse sections; below arrow - coronal section images. RNS = Renal nephrometry scores